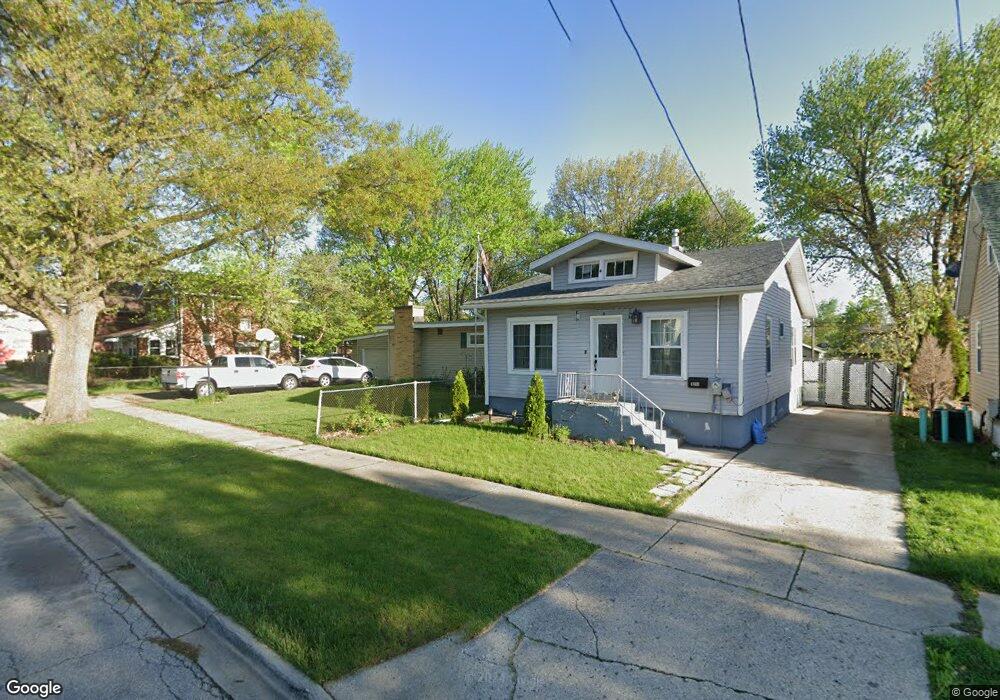
1010 Grove St Aurora, IL 60505
Light of the Community NeighborhoodEstimated Value: $253,718 - $266,000
3
Beds
3
Baths
1,360
Sq Ft
$191/Sq Ft
Est. Value
About This Home
This home is located at 1010 Grove St, Aurora, IL 60505 and is currently estimated at $259,930, approximately $191 per square foot. 1010 Grove St is a home located in Kane County with nearby schools including Oak Park Elementary School, Henry W Cowherd Middle School, and East Aurora High School.
Ownership History
Date
Name
Owned For
Owner Type
Purchase Details
Closed on
Jan 19, 2013
Sold by
Matolek Julius L and Schoor Lisa J
Bought by
Matolek Julius L
Current Estimated Value
Home Financials for this Owner
Home Financials are based on the most recent Mortgage that was taken out on this home.
Original Mortgage
$120,200
Outstanding Balance
$86,930
Interest Rate
4.25%
Mortgage Type
New Conventional
Estimated Equity
$173,000
Purchase Details
Closed on
Aug 3, 1993
Sold by
Aurora Fsb
Bought by
Matolek Julius L and Matolek Lisa J
Create a Home Valuation Report for This Property
The Home Valuation Report is an in-depth analysis detailing your home's value as well as a comparison with similar homes in the area
Home Values in the Area
Average Home Value in this Area
Purchase History
| Date | Buyer | Sale Price | Title Company |
|---|---|---|---|
| Matolek Julius L | -- | None Available | |
| Matolek Julius L | $67,000 | Land Title Group |
Source: Public Records
Mortgage History
| Date | Status | Borrower | Loan Amount |
|---|---|---|---|
| Open | Matolek Julius L | $120,200 |
Source: Public Records
Tax History Compared to Growth
Tax History
| Year | Tax Paid | Tax Assessment Tax Assessment Total Assessment is a certain percentage of the fair market value that is determined by local assessors to be the total taxable value of land and additions on the property. | Land | Improvement |
|---|---|---|---|---|
| 2024 | $1,001 | $72,903 | $10,021 | $62,882 |
| 2023 | $1,091 | $64,374 | $8,954 | $55,420 |
| 2022 | $1,489 | $58,425 | $8,170 | $50,255 |
| 2021 | $1,583 | $54,394 | $7,606 | $46,788 |
| 2020 | $1,630 | $50,524 | $7,065 | $43,459 |
| 2019 | $1,727 | $52,101 | $6,546 | $45,555 |
| 2018 | $1,785 | $46,706 | $6,055 | $40,651 |
| 2017 | $1,923 | $40,536 | $5,579 | $34,957 |
| 2016 | $2,063 | $35,273 | $4,782 | $30,491 |
| 2015 | -- | $30,604 | $4,112 | $26,492 |
| 2014 | -- | $29,258 | $3,779 | $25,479 |
| 2013 | -- | $31,625 | $3,611 | $28,014 |
Source: Public Records
Map
Nearby Homes
- 1038 Liberty St
- 1105 Indian Ave
- 226 N Ohio St
- 1147 Rural St Unit 41
- 172 N East Ave
- 608 Front St
- 1311 Kane St
- 257 Vermont Ave
- 1611 Indian Ave
- 131 N Kendall St
- 15 Hill Ave
- 574 E Galena Blvd
- 409 Dayward Ct
- 773 Aurora Ave
- 1009 Assell Ave
- 1671 Sheffer Rd
- 0000 N Farnsworth Ave
- 1900 E New York St
- 438 North Ave
- 466 Hinman St