1010 Hickman Rd Unit D5 Augusta, GA 30904
Summerville NeighborhoodEstimated Value: $148,752 - $175,000
2
Beds
1
Bath
1,260
Sq Ft
$130/Sq Ft
Est. Value
About This Home
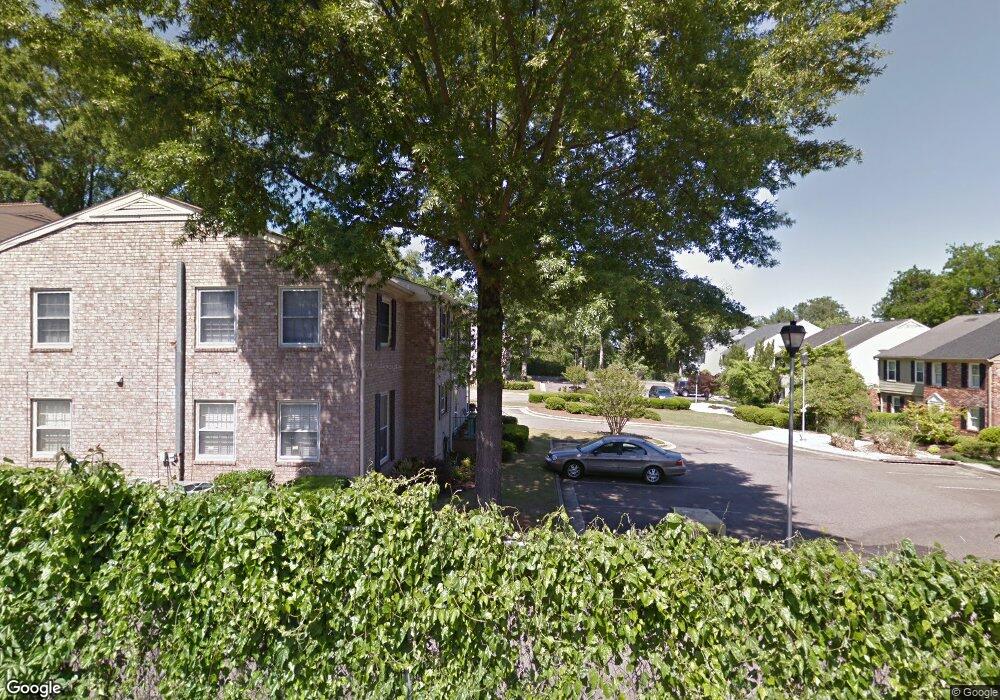
This home is located at 1010 Hickman Rd Unit D5, Augusta, GA 30904 and is currently estimated at $164,188, approximately $130 per square foot. 1010 Hickman Rd Unit D5 is a home located in Richmond County with nearby schools including Lake Forest Hills Elementary School, Johnson Magnet, and Tutt Middle School.
Ownership History
Date
Name
Owned For
Owner Type
Purchase Details
Closed on
Sep 21, 2001
Sold by
Dijamco Armando C and Dijamco Alice L
Bought by
Savage Jeanette L
Current Estimated Value
Home Financials for this Owner
Home Financials are based on the most recent Mortgage that was taken out on this home.
Original Mortgage
$59,500
Outstanding Balance
$22,251
Interest Rate
6.89%
Estimated Equity
$141,937
Purchase Details
Closed on
May 1, 1997
Sold by
Hood Carolyn Hood Carolyn D
Bought by
Farr Clyde P
Purchase Details
Closed on
Apr 30, 1997
Sold by
Hood Carolyn
Bought by
Farr Clyde P
Purchase Details
Closed on
Mar 18, 1992
Sold by
Yeh Thomas J By Atty
Bought by
Hood Carolyn
Purchase Details
Closed on
Jan 24, 1992
Sold by
Yeh Thomas J By Att
Bought by
Hood Carolyn
Purchase Details
Closed on
Jun 1, 1984
Create a Home Valuation Report for This Property
The Home Valuation Report is an in-depth analysis detailing your home's value as well as a comparison with similar homes in the area
Home Values in the Area
Average Home Value in this Area
Purchase History
| Date | Buyer | Sale Price | Title Company |
|---|---|---|---|
| Savage Jeanette L | $82,400 | -- | |
| Farr Clyde P | -- | -- | |
| Farr Clyde P | $42,000 | -- | |
| Hood Carolyn | -- | -- | |
| Yeh Thomas J | -- | -- | |
| Hood Carolyn | $32,500 | -- | |
| Yeh Thomas J | -- | -- | |
| -- | $50,000 | -- |
Source: Public Records
Mortgage History
| Date | Status | Borrower | Loan Amount |
|---|---|---|---|
| Open | Savage Jeanette L | $59,500 |
Source: Public Records
Tax History
| Year | Tax Paid | Tax Assessment Tax Assessment Total Assessment is a certain percentage of the fair market value that is determined by local assessors to be the total taxable value of land and additions on the property. | Land | Improvement |
|---|---|---|---|---|
| 2025 | $675 | $52,276 | $8,000 | $44,276 |
| 2024 | $675 | $68,888 | $8,000 | $60,888 |
| 2023 | $481 | $55,480 | $8,000 | $47,480 |
| 2022 | $681 | $48,027 | $8,000 | $40,027 |
| 2021 | $613 | $38,802 | $8,000 | $30,802 |
| 2020 | $515 | $31,722 | $3,720 | $28,002 |
| 2019 | $417 | $31,722 | $3,720 | $28,002 |
| 2018 | $421 | $31,722 | $3,720 | $28,002 |
| 2017 | $422 | $31,722 | $3,720 | $28,002 |
| 2016 | $422 | $31,722 | $3,720 | $28,002 |
| 2015 | $778 | $31,722 | $3,720 | $28,002 |
| 2014 | $1,090 | $31,722 | $3,720 | $28,002 |
Source: Public Records
Map
Nearby Homes
- 956 Heard Ave
- 2016 Hampton Ave
- 978 Heard Ave
- 930 Heard Ave
- 925 B Russell St
- 2110 Carnes Place
- 2201 Clayton Ln
- 2203 Clayton Ln
- 2207 Clayton Ln
- 2211 Clayton Ln
- 1208 Hickman Rd
- 2213 Clayton Ln
- 2144 Central Ave
- 844 Heard Ave
- 1224 Meigs St
- 1213 Heard Ave
- 2014 Richmond Ave
- 1904 Central Ave
- 812 Russell St
- 2232 Mcdowell St
- 1010 Hickman Rd
- 1010 Hickman Rd Unit G2
- 1010 Hickman Rd
- 1010 Hickman Rd Unit G1
- 1010 Hickman Rd Unit F2
- 1010 Hickman Rd Unit F1
- 1010 Hickman Rd Unit E2
- 1010 Hickman Rd Unit E1
- 1010 Hickman Rd Unit J1
- 1010 Hickman Rd Unit D6
- 1010 Hickman Rd Unit D4
- 1010 Hickman Rd Unit D3
- 1010 Hickman Rd Unit D2
- 1010 Hickman Rd Unit D1
- 1010 Hickman Rd Unit B6
- 1010 Hickman Rd Unit B4
- 1010 Hickman Rd Unit B2
- 1010 Hickman Rd Unit B1
- 1010 Hickman Rd Unit A4
- 1010 Hickman Rd Unit A3
Your Personal Tour Guide
Ask me questions while you tour the home.