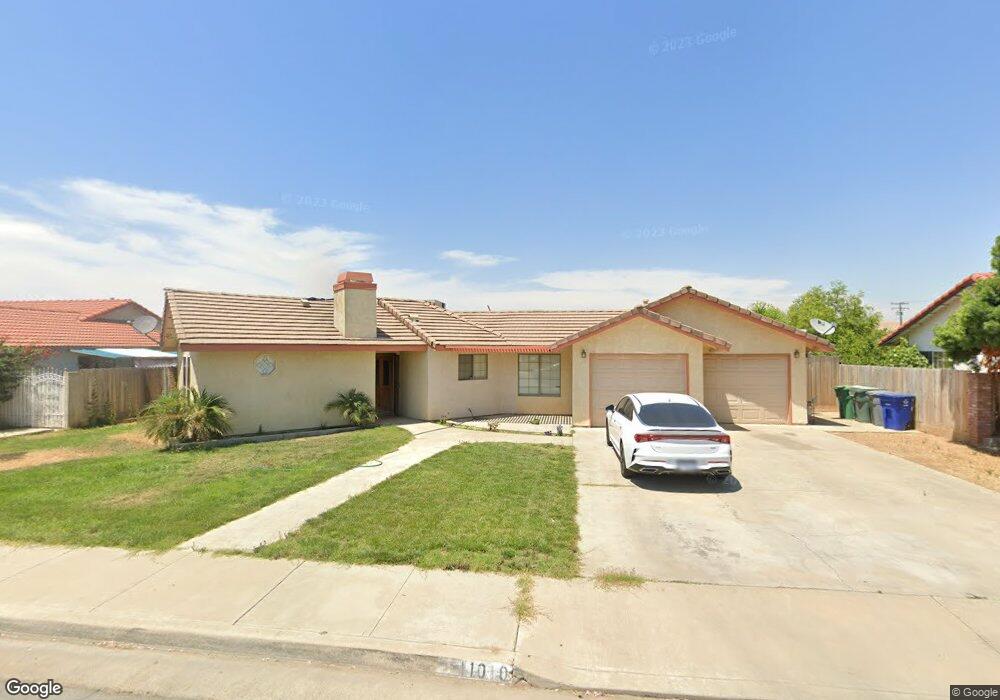
1010 Lea Way Lindsay, CA 93247
Estimated Value: $346,509 - $415,000
3
Beds
2
Baths
1,729
Sq Ft
$215/Sq Ft
Est. Value
About This Home
This home is located at 1010 Lea Way, Lindsay, CA 93247 and is currently estimated at $371,377, approximately $214 per square foot. 1010 Lea Way is a home located in Tulare County with nearby schools including Roosevelt Elementary School and Lindsay Senior High School.
Ownership History
Date
Name
Owned For
Owner Type
Purchase Details
Closed on
May 2, 2013
Sold by
City Of Lindsay
Bought by
Castro Irineo
Current Estimated Value
Home Financials for this Owner
Home Financials are based on the most recent Mortgage that was taken out on this home.
Original Mortgage
$42,000
Outstanding Balance
$29,614
Interest Rate
3.37%
Mortgage Type
Seller Take Back
Estimated Equity
$341,763
Purchase Details
Closed on
Jul 18, 2012
Sold by
Meik Nathan M
Bought by
City Of Lindsay
Purchase Details
Closed on
Dec 16, 2005
Sold by
Gonzales Martin A
Bought by
Meik Nathan M and Faith Meik R
Home Financials for this Owner
Home Financials are based on the most recent Mortgage that was taken out on this home.
Original Mortgage
$224,400
Interest Rate
6.32%
Mortgage Type
Purchase Money Mortgage
Purchase Details
Closed on
Jan 28, 2002
Sold by
Marshall Russell A
Bought by
Gonzalez Martin A and Gonzales Elisa
Home Financials for this Owner
Home Financials are based on the most recent Mortgage that was taken out on this home.
Original Mortgage
$95,200
Interest Rate
6.99%
Purchase Details
Closed on
Nov 8, 2001
Sold by
Picciuto Anthony
Bought by
Picciuto Jeffrey M and Picciuto Stacy
Create a Home Valuation Report for This Property
The Home Valuation Report is an in-depth analysis detailing your home's value as well as a comparison with similar homes in the area
Home Values in the Area
Average Home Value in this Area
Purchase History
| Date | Buyer | Sale Price | Title Company |
|---|---|---|---|
| Castro Irineo | $152,000 | Chicago Title Company | |
| City Of Lindsay | $187,321 | Chicago Title Company | |
| Meik Nathan M | $287,000 | Stewart Title Of California | |
| Gonzalez Martin A | $119,000 | First American Title Co | |
| Picciuto Jeffrey M | -- | -- |
Source: Public Records
Mortgage History
| Date | Status | Borrower | Loan Amount |
|---|---|---|---|
| Open | Castro Irineo | $42,000 | |
| Previous Owner | Meik Nathan M | $224,400 | |
| Previous Owner | Gonzalez Martin A | $95,200 |
Source: Public Records
Tax History Compared to Growth
Tax History
| Year | Tax Paid | Tax Assessment Tax Assessment Total Assessment is a certain percentage of the fair market value that is determined by local assessors to be the total taxable value of land and additions on the property. | Land | Improvement |
|---|---|---|---|---|
| 2025 | $2,608 | $187,174 | $43,099 | $144,075 |
| 2024 | $2,608 | $183,504 | $42,254 | $141,250 |
| 2023 | $2,715 | $179,907 | $41,426 | $138,481 |
| 2022 | $3,281 | $176,380 | $40,614 | $135,766 |
| 2021 | $2,931 | $172,922 | $39,818 | $133,104 |
| 2020 | $1,951 | $171,149 | $39,410 | $131,739 |
| 2019 | $1,935 | $167,793 | $38,637 | $129,156 |
| 2018 | $1,886 | $164,503 | $37,879 | $126,624 |
| 2017 | $1,877 | $161,277 | $37,136 | $124,141 |
| 2016 | $1,793 | $158,115 | $36,408 | $121,707 |
| 2015 | $1,881 | $155,740 | $35,861 | $119,879 |
| 2014 | $1,852 | $152,690 | $35,159 | $117,531 |
Source: Public Records
Map
Nearby Homes
- 18995 Avenue 232
- 517 N Westwood Ave
- 0 Blue Gum Unit 235207
- 0 Blue Gum Unit 235206
- 430 Central Ave
- 330 Van Ness Ave
- 1323 Homassel Ave
- 660 E Tulare Rd
- 132 N Gale Hill Ave
- 196 S Mirage Ave
- 24104 N Bellah Ave
- 216 Oxford Ave
- 207 Pleasant St
- 1021 Princeton Ave
- 1285 Road 216
- 1341 Hillcrest Dr
- 143 N Harvard Ave
- 1065 W Yale Ave
- 1061 Laurel Ave
- 24796 Road 216
- 0 Marc - Anthony Place
- 1014 Lea Way
- 1006 Lea Way
- 1005 Lea Way
- 1016 Lea Way
- 843 Marc Anthony Place
- 1001 Lea Way
- 840 Marc Anthony Place
- 833 Ash Ave
- 1018 Lea Way
- 839 Marc Anthony Place
- 1017 Lea Way
- 836 Marc Anthony Place
- 838 Michael Lynn Place
- 1020 Lea Way
- 835 Marc Anthony Place
- 840 Ash Ave
- 842 Ash Ave
- 0 Michael Lynn Place
- 838 Ash Ave