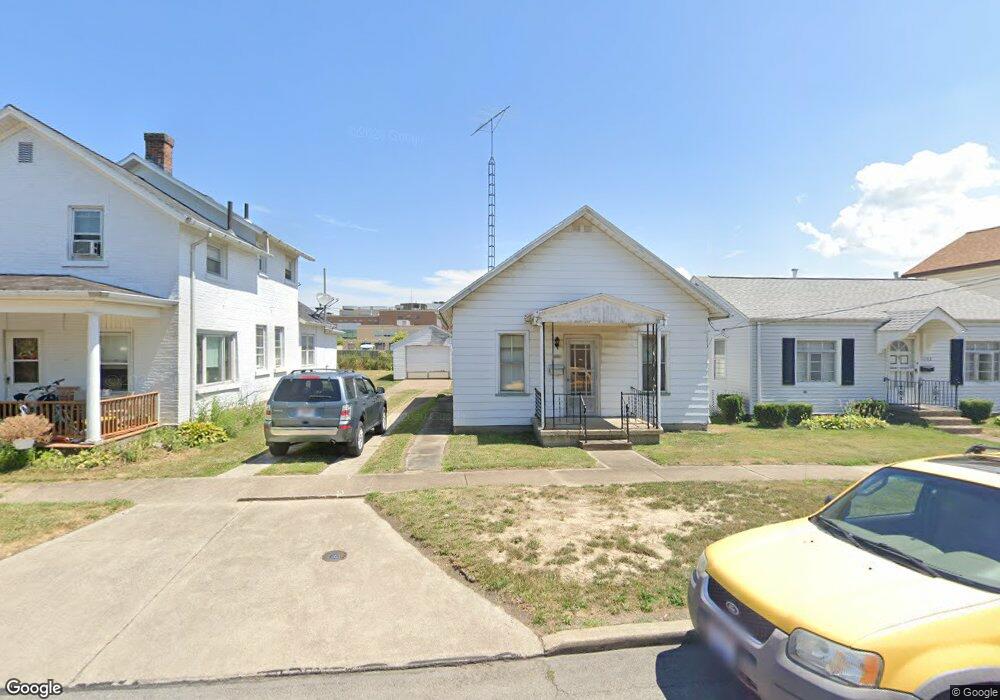
1010 Maple Ave Sandusky, OH 44870
Estimated Value: $206,000 - $257,000
2
Beds
1
Bath
1,684
Sq Ft
$137/Sq Ft
Est. Value
About This Home
This home is located at 1010 Maple Ave, Sandusky, OH 44870 and is currently estimated at $230,130, approximately $136 per square foot. 1010 Maple Ave is a home located in Erie County with nearby schools including Sandusky High School, Monroe Preparatory Academy, and Sandusky Central Catholic School.
Ownership History
Date
Name
Owned For
Owner Type
Purchase Details
Closed on
Oct 17, 2019
Sold by
Jenne Kristine E and Biecheler Katherine L
Bought by
Jenne Kristine E and Biecheler Katherine L
Current Estimated Value
Home Financials for this Owner
Home Financials are based on the most recent Mortgage that was taken out on this home.
Original Mortgage
$46,920
Outstanding Balance
$40,735
Interest Rate
3.7%
Mortgage Type
Purchase Money Mortgage
Estimated Equity
$189,395
Purchase Details
Closed on
May 7, 2013
Sold by
Scherer Alice E and Scherer Alice C
Bought by
Livi Scherer Alice E and Livi Alice E Scherer Revocable
Purchase Details
Closed on
Jun 27, 2003
Sold by
Veleba Cynthia Ann and Veleba Patrick Theodore
Bought by
Patrick Theodore and Patrick Cynthia Ann
Create a Home Valuation Report for This Property
The Home Valuation Report is an in-depth analysis detailing your home's value as well as a comparison with similar homes in the area
Home Values in the Area
Average Home Value in this Area
Purchase History
| Date | Buyer | Sale Price | Title Company |
|---|---|---|---|
| Jenne Kristine E | $45,500 | None Available | |
| Jenne Kristine E | -- | None Available | |
| Scherer Charles W | -- | None Available | |
| Livi Scherer Alice E | -- | None Available | |
| Patrick Theodore | -- | Southern Title Of Ohio Ltd | |
| Veleba Cynthia Ann | -- | Southern Title Of Ohio Ltd |
Source: Public Records
Mortgage History
| Date | Status | Borrower | Loan Amount |
|---|---|---|---|
| Open | Jenne Kristine E | $46,920 |
Source: Public Records
Tax History
| Year | Tax Paid | Tax Assessment Tax Assessment Total Assessment is a certain percentage of the fair market value that is determined by local assessors to be the total taxable value of land and additions on the property. | Land | Improvement |
|---|---|---|---|---|
| 2025 | $2,294 | $60,504 | $14,077 | $46,427 |
| 2024 | $2,294 | $60,504 | $14,077 | $46,427 |
| 2023 | $2,280 | $48,170 | $10,556 | $37,614 |
| 2022 | $2,128 | $48,170 | $10,556 | $37,614 |
| 2021 | $2,058 | $48,170 | $10,560 | $37,610 |
| 2020 | $1,880 | $41,500 | $10,560 | $30,940 |
| 2019 | $1,493 | $41,500 | $10,560 | $30,940 |
| 2018 | $1,592 | $41,500 | $10,560 | $30,940 |
| 2017 | $1,390 | $38,320 | $11,720 | $26,600 |
| 2016 | $1,370 | $38,320 | $11,720 | $26,600 |
| 2015 | $1,403 | $38,320 | $11,720 | $26,600 |
| 2014 | $1,449 | $38,320 | $11,720 | $26,600 |
| 2013 | $1,347 | $38,320 | $11,720 | $26,600 |
Source: Public Records
Map
Nearby Homes
- 17 Tyler Way
- 1308 Vine St
- 808 Fulton St
- 1308 Stone St
- 823 Decatur St
- 602 W Monroe St
- 811 W Osborne St
- 1204 W Monroe St
- 932 W Madison St
- 1104 Hayes Ave
- 1505 Central Ave
- 1203 W Monroe St
- 911 A St
- 39 Zachary Dr S
- 1016 Hayes Ave
- 1330 Carr St
- 1604 Central Ave
- 1334 Lindsley St
- 528 Central Ave
- 1225 W Osborne St
- 1010 Maple Ave
- 1202 Maple Ave
- 1204 Maple Ave
- 1004 E Maple Ave
- 0 Maple Ave
- 1202 Central Ave
- 1014 Central Ave
- 1204 Central Ave
- 1012 Central Ave
- 1211 Prospect St
- 1210 Central Ave
- 1008 Central Ave
- 1208 Maple Ave
- 1212 Central Ave
- 1002 Central Ave
- 1215 Prospect St
- 1208 Central Ave
- 922 Central Ave
- 1212 E Maple Ave
- 1216 Central Ave
Your Personal Tour Guide
Ask me questions while you tour the home.