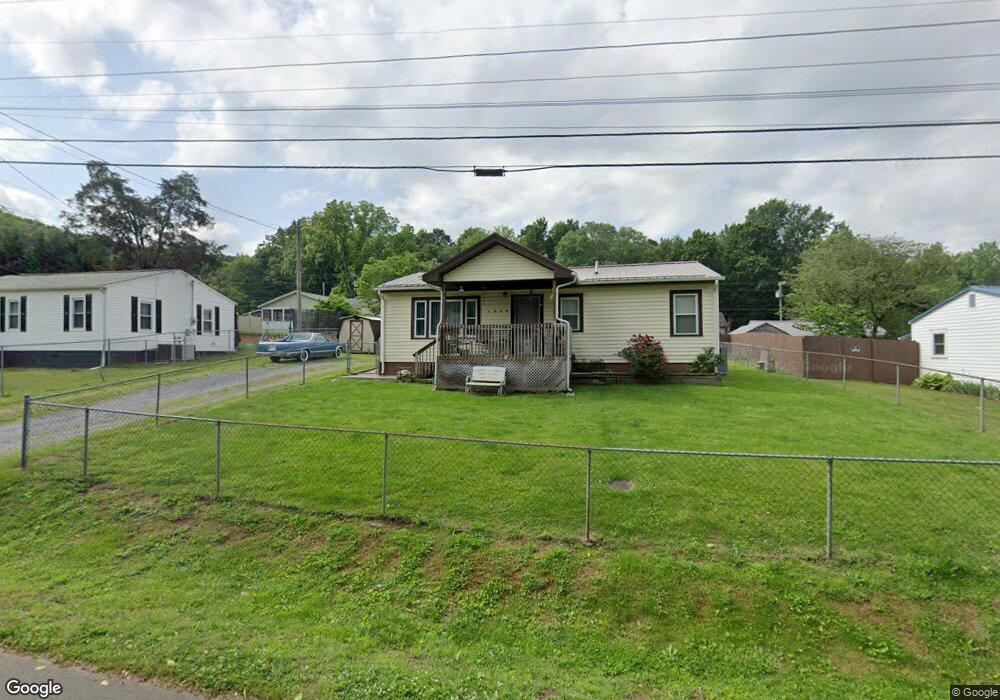
1010 Marsh Ave Morristown, TN 37814
Estimated Value: $127,072 - $208,000
--
Bed
1
Bath
1,026
Sq Ft
$169/Sq Ft
Est. Value
About This Home
This home is located at 1010 Marsh Ave, Morristown, TN 37814 and is currently estimated at $173,018, approximately $168 per square foot. 1010 Marsh Ave is a home located in Hamblen County with nearby schools including Fairview-Marguerite Elementary School, Meadowview Middle School, and Morristown East High School.
Ownership History
Date
Name
Owned For
Owner Type
Purchase Details
Closed on
Jan 20, 2012
Sold by
Harmon David E
Bought by
Tharp Jeff and Tharp Sylvia
Current Estimated Value
Home Financials for this Owner
Home Financials are based on the most recent Mortgage that was taken out on this home.
Original Mortgage
$62,000
Interest Rate
3.97%
Mortgage Type
Commercial
Purchase Details
Closed on
Sep 8, 2011
Sold by
Secretary Of Housing And U
Bought by
Harmon David E
Purchase Details
Closed on
Jun 10, 2010
Sold by
Lawson Patsy A
Bought by
Secretary Of Housing
Purchase Details
Closed on
May 19, 1999
Bought by
Lawson Patsy A
Home Financials for this Owner
Home Financials are based on the most recent Mortgage that was taken out on this home.
Original Mortgage
$48,365
Interest Rate
6.9%
Purchase Details
Closed on
Jul 18, 1986
Bought by
Crigger Frank and Crigger Betty
Purchase Details
Closed on
Apr 18, 1986
Create a Home Valuation Report for This Property
The Home Valuation Report is an in-depth analysis detailing your home's value as well as a comparison with similar homes in the area
Home Values in the Area
Average Home Value in this Area
Purchase History
| Date | Buyer | Sale Price | Title Company |
|---|---|---|---|
| Tharp Jeff | $65,000 | -- | |
| Harmon David E | $20,111 | -- | |
| Secretary Of Housing | -- | -- | |
| Lawson Patsy A | $47,900 | -- | |
| Crigger Frank | $19,600 | -- | |
| -- | $4,000 | -- |
Source: Public Records
Mortgage History
| Date | Status | Borrower | Loan Amount |
|---|---|---|---|
| Open | Not Available | $47,000 | |
| Closed | Tharp Jeff | $62,000 | |
| Previous Owner | Not Available | $48,365 |
Source: Public Records
Tax History Compared to Growth
Tax History
| Year | Tax Paid | Tax Assessment Tax Assessment Total Assessment is a certain percentage of the fair market value that is determined by local assessors to be the total taxable value of land and additions on the property. | Land | Improvement |
|---|---|---|---|---|
| 2024 | $311 | $17,650 | $2,275 | $15,375 |
| 2023 | $311 | $17,650 | $0 | $0 |
| 2022 | $558 | $17,650 | $2,275 | $15,375 |
| 2021 | $558 | $17,650 | $2,275 | $15,375 |
| 2020 | $311 | $17,650 | $2,275 | $15,375 |
| 2019 | $523 | $15,375 | $2,125 | $13,250 |
| 2018 | $484 | $15,375 | $2,125 | $13,250 |
| 2017 | $477 | $15,375 | $2,125 | $13,250 |
| 2016 | $456 | $15,375 | $2,125 | $13,250 |
| 2015 | $423 | $15,375 | $2,125 | $13,250 |
| 2014 | -- | $15,375 | $2,125 | $13,250 |
| 2013 | -- | $15,850 | $0 | $0 |
Source: Public Records
Map
Nearby Homes
- 1420 Buffalo Trail
- 637 Carriger St
- 1215 Shields Ferry Rd
- 000 Devault St
- 1101 Sherwood Dr
- 1449 N Easley Ct
- 1542 Shields Ferry Rd
- 1562 Shields Ferry Rd
- 1324 Davis St
- 1111 Carmichael St
- 2358 Stream View Ln
- 602 Hilltop Dr
- 1323 Goodson Ave
- 311 E 4th St N
- 400 E 4th St N
- 215 E 5th St N
- 1126 E 2nd St N
- 721 E 1st North St
- 721 E 1st St N
- 551 Callaway Dr