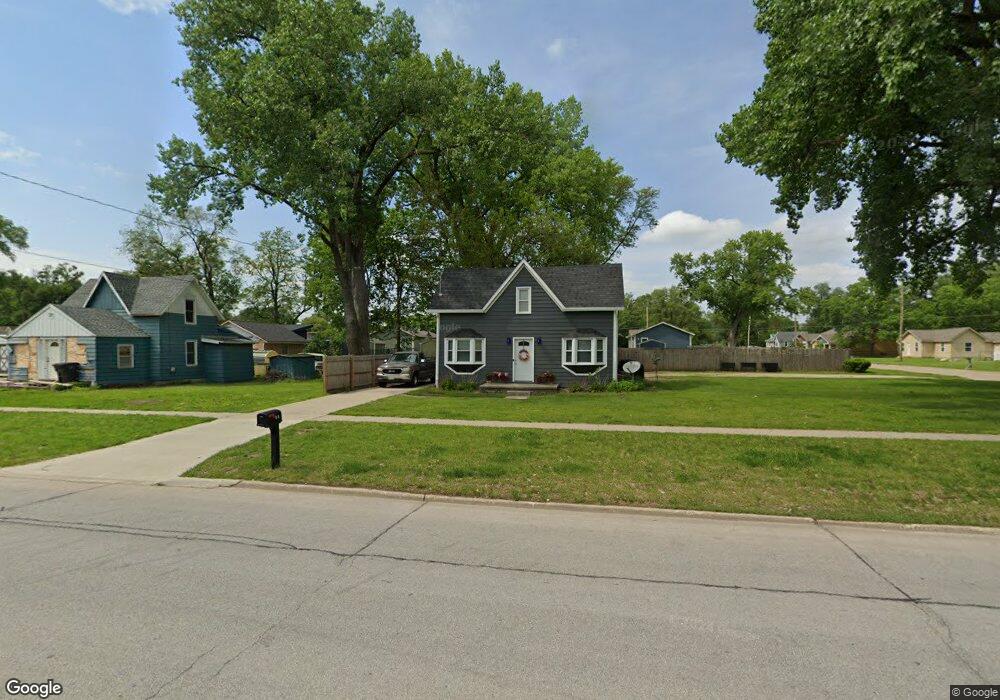
1010 Maury St Des Moines, IA 50309
East Village NeighborhoodEstimated Value: $190,514 - $254,000
4
Beds
1
Bath
1,318
Sq Ft
$157/Sq Ft
Est. Value
About This Home
This home is located at 1010 Maury St, Des Moines, IA 50309 and is currently estimated at $207,129, approximately $157 per square foot. 1010 Maury St is a home located in Polk County with nearby schools including Capitol View Elementary School, Hiatt Middle School, and East High School.
Ownership History
Date
Name
Owned For
Owner Type
Purchase Details
Closed on
Jul 23, 2004
Sold by
Cosper Randy and Witt Cosper Teri
Bought by
Forney Curtis and Forney Brenda
Current Estimated Value
Home Financials for this Owner
Home Financials are based on the most recent Mortgage that was taken out on this home.
Original Mortgage
$88,065
Outstanding Balance
$44,570
Interest Rate
6.42%
Mortgage Type
Purchase Money Mortgage
Estimated Equity
$162,559
Purchase Details
Closed on
Jun 14, 2003
Sold by
Robinson April Ann
Bought by
Cosper Randy and Witt Cosper Teri
Create a Home Valuation Report for This Property
The Home Valuation Report is an in-depth analysis detailing your home's value as well as a comparison with similar homes in the area
Home Values in the Area
Average Home Value in this Area
Purchase History
| Date | Buyer | Sale Price | Title Company |
|---|---|---|---|
| Forney Curtis | $92,500 | -- | |
| Cosper Randy | $5,500 | -- |
Source: Public Records
Mortgage History
| Date | Status | Borrower | Loan Amount |
|---|---|---|---|
| Open | Forney Curtis | $88,065 |
Source: Public Records
Tax History Compared to Growth
Tax History
| Year | Tax Paid | Tax Assessment Tax Assessment Total Assessment is a certain percentage of the fair market value that is determined by local assessors to be the total taxable value of land and additions on the property. | Land | Improvement |
|---|---|---|---|---|
| 2024 | $2,572 | $148,200 | $20,000 | $128,200 |
| 2023 | $2,768 | $148,200 | $20,000 | $128,200 |
| 2022 | $2,744 | $126,300 | $17,600 | $108,700 |
| 2021 | $2,738 | $126,300 | $17,600 | $108,700 |
| 2020 | $2,838 | $118,300 | $16,500 | $101,800 |
| 2019 | $2,754 | $118,300 | $16,500 | $101,800 |
| 2018 | $2,720 | $111,000 | $15,300 | $95,700 |
| 2017 | $2,620 | $111,000 | $15,300 | $95,700 |
| 2016 | $478 | $105,400 | $14,300 | $91,100 |
| 2015 | $478 | $105,400 | $14,300 | $91,100 |
| 2014 | $352 | $101,200 | $13,300 | $87,900 |
Source: Public Records
Map
Nearby Homes
- 811 SE 11th St
- 815 SE 11th St
- 819 SE 11th St
- 823 SE 11th St
- 905 Shaw St
- 525 SE 9th St
- 825 SE 8th St
- 821 E Jackson Ave
- 104 E 15th St
- 816 E Dunham Ave
- 808 E Dunham Ave
- 436 E Granger Ave
- 814 E Edison Ave
- 800 E Edison Ave
- 816 E Edison Ave
- 818 E Edison Ave
- 317 E Jackson Ave
- 409 E Granger Ave
- 405 E Granger Ave
- 913 E Hillside Ave