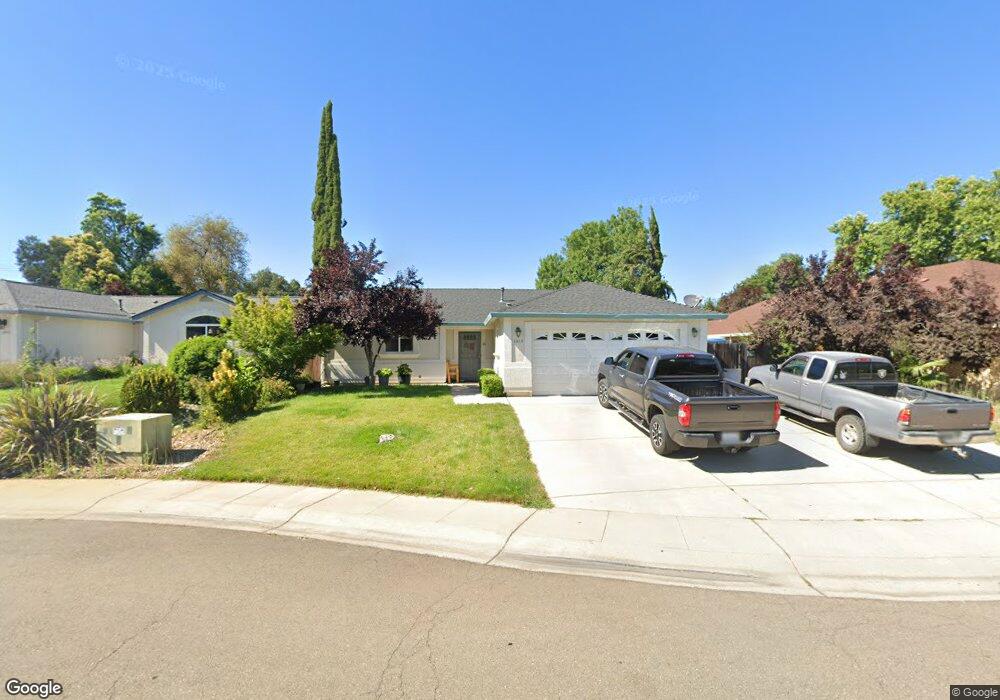
1010 Monterra Ln Redding, CA 96002
Enterprise NeighborhoodEstimated Value: $345,101 - $365,000
3
Beds
2
Baths
1,412
Sq Ft
$252/Sq Ft
Est. Value
About This Home
This home is located at 1010 Monterra Ln, Redding, CA 96002 and is currently estimated at $355,775, approximately $251 per square foot. 1010 Monterra Ln is a home located in Shasta County with nearby schools including Lassen View Elementary School, Parsons Junior High School, and Enterprise High School.
Ownership History
Date
Name
Owned For
Owner Type
Purchase Details
Closed on
May 18, 2005
Sold by
Red Rock Investments
Bought by
Saelee Kao and Saetern Chan
Current Estimated Value
Home Financials for this Owner
Home Financials are based on the most recent Mortgage that was taken out on this home.
Original Mortgage
$38,200
Interest Rate
5.28%
Mortgage Type
Stand Alone Second
Create a Home Valuation Report for This Property
The Home Valuation Report is an in-depth analysis detailing your home's value as well as a comparison with similar homes in the area
Home Values in the Area
Average Home Value in this Area
Purchase History
| Date | Buyer | Sale Price | Title Company |
|---|---|---|---|
| Saelee Kao | $255,000 | First American Title Co |
Source: Public Records
Mortgage History
| Date | Status | Borrower | Loan Amount |
|---|---|---|---|
| Closed | Saelee Kao | $38,200 | |
| Open | Saelee Kao | $203,900 |
Source: Public Records
Tax History
| Year | Tax Paid | Tax Assessment Tax Assessment Total Assessment is a certain percentage of the fair market value that is determined by local assessors to be the total taxable value of land and additions on the property. | Land | Improvement |
|---|---|---|---|---|
| 2025 | $4,161 | $359,391 | $125,443 | $233,948 |
| 2024 | $4,073 | $352,345 | $122,984 | $229,361 |
| 2023 | $4,073 | $345,437 | $120,573 | $224,864 |
| 2022 | $3,940 | $338,664 | $118,209 | $220,455 |
| 2021 | $3,375 | $300,000 | $55,000 | $245,000 |
| 2020 | $3,040 | $270,000 | $50,000 | $220,000 |
| 2019 | $2,789 | $240,000 | $50,000 | $190,000 |
| 2018 | $2,665 | $227,000 | $45,000 | $182,000 |
| 2017 | $2,735 | $217,000 | $45,000 | $172,000 |
| 2016 | $2,468 | $217,000 | $45,000 | $172,000 |
| 2015 | $2,449 | $217,000 | $45,000 | $172,000 |
| 2014 | $2,236 | $200,000 | $40,000 | $160,000 |
Source: Public Records
Map
Nearby Homes
- 4020 Churn Creek Rd
- 1354 Harpole Rd
- 3759 Alma Ave
- 4323 Churn Crk Rd
- 737 Estate St
- 751 Woodacre Dr
- 688 Julie Way
- 1513 Harpole Rd
- 4302 Paulson Ln
- 3708 Traverse St
- 3527 Adams Ln
- 3689 Suzanne Way
- 607 Woodacre Dr
- 3540 Ricardo Ave
- 1397 Empress Ln
- 3360 Lawrence Rd
- 1091 Del Sol Place
- 1075 Le Brun Ln
- 1108 4th St
- 1289 Arizona St
- 1016 Monterra Ln
- 1006 Monterra Ln
- 1055 de Moll Dr
- 1020 Monterra Ln
- 1065 de Moll Dr
- 3925 Churn Creek Rd
- 3934 Ethan Ln
- 1013 Monterra Ln
- 1075 de Moll Dr
- 1026 Monterra Ln
- 1051 de Moll Dr
- 3964 Ethan Ln
- 1021 Monterra Ln
- 3994 Ethan Ln
- 3911 Churn Creek Rd Unit 1
- 3911 Churn Creek Rd
- 1085 de Moll Dr Unit 1
- 1085 de Moll Dr
- 1030 Monterra Ln
- 1027 Monterra Ln
Your Personal Tour Guide
Ask me questions while you tour the home.