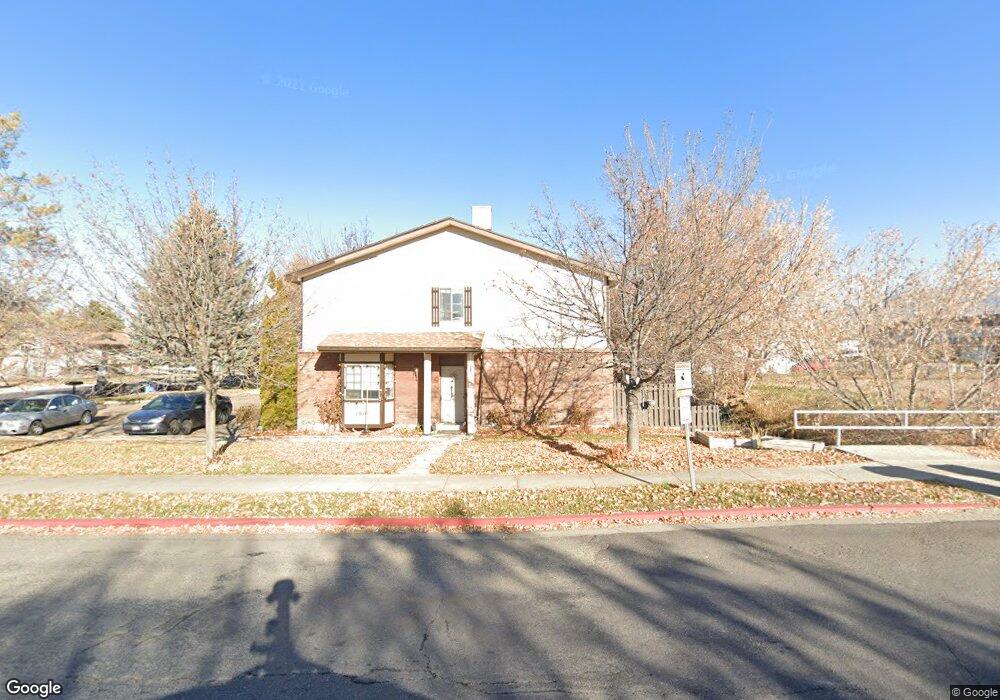
1010 N 250 W Logan, UT 84341
Bridger NeighborhoodEstimated Value: $246,000 - $275,000
2
Beds
2
Baths
1,112
Sq Ft
$233/Sq Ft
Est. Value
About This Home
This home is located at 1010 N 250 W, Logan, UT 84341 and is currently estimated at $258,706, approximately $232 per square foot. 1010 N 250 W is a home located in Cache County with nearby schools including Bridger School, Mount Logan Middle School, and Logan High School.
Ownership History
Date
Name
Owned For
Owner Type
Purchase Details
Closed on
Apr 30, 2019
Sold by
Mullins Brent
Bought by
Clements Naomi V and Clements Anna E
Current Estimated Value
Home Financials for this Owner
Home Financials are based on the most recent Mortgage that was taken out on this home.
Original Mortgage
$117,855
Outstanding Balance
$103,190
Interest Rate
4.2%
Mortgage Type
New Conventional
Estimated Equity
$155,516
Purchase Details
Closed on
Aug 18, 2017
Sold by
Caceres Rafael and Caceres Doris E
Bought by
Mullins Brent
Home Financials for this Owner
Home Financials are based on the most recent Mortgage that was taken out on this home.
Original Mortgage
$101,624
Interest Rate
4.4%
Mortgage Type
FHA
Purchase Details
Closed on
Aug 20, 2009
Sold by
Roundy Jessica and Ringle Jessica
Bought by
Caceres Rafael and Caceres Doris E
Home Financials for this Owner
Home Financials are based on the most recent Mortgage that was taken out on this home.
Original Mortgage
$85,424
Interest Rate
5.17%
Mortgage Type
FHA
Create a Home Valuation Report for This Property
The Home Valuation Report is an in-depth analysis detailing your home's value as well as a comparison with similar homes in the area
Home Values in the Area
Average Home Value in this Area
Purchase History
| Date | Buyer | Sale Price | Title Company |
|---|---|---|---|
| Clements Naomi V | -- | First American Title Ins Co | |
| Mullins Brent | -- | None Available | |
| Caceres Rafael | -- | Cache Title Company |
Source: Public Records
Mortgage History
| Date | Status | Borrower | Loan Amount |
|---|---|---|---|
| Open | Clements Naomi V | $117,855 | |
| Previous Owner | Mullins Brent | $101,624 | |
| Previous Owner | Caceres Rafael | $85,424 |
Source: Public Records
Tax History
| Year | Tax Paid | Tax Assessment Tax Assessment Total Assessment is a certain percentage of the fair market value that is determined by local assessors to be the total taxable value of land and additions on the property. | Land | Improvement |
|---|---|---|---|---|
| 2025 | $1,042 | $134,775 | $0 | $0 |
| 2024 | $1,099 | $137,610 | $0 | $0 |
| 2023 | $966 | $115,340 | $0 | $0 |
| 2022 | $976 | $108,820 | $0 | $0 |
| 2021 | $924 | $159,120 | $30,000 | $129,120 |
| 2020 | $888 | $137,600 | $30,000 | $107,600 |
| 2019 | $660 | $97,930 | $30,000 | $67,930 |
| 2018 | $647 | $87,568 | $30,000 | $57,568 |
| 2017 | $548 | $39,270 | $0 | $0 |
| 2016 | $569 | $39,270 | $0 | $0 |
| 2015 | $569 | $39,270 | $0 | $0 |
| 2014 | $590 | $45,000 | $0 | $0 |
| 2013 | -- | $45,000 | $0 | $0 |
Source: Public Records
Map
Nearby Homes
Your Personal Tour Guide
Ask me questions while you tour the home.