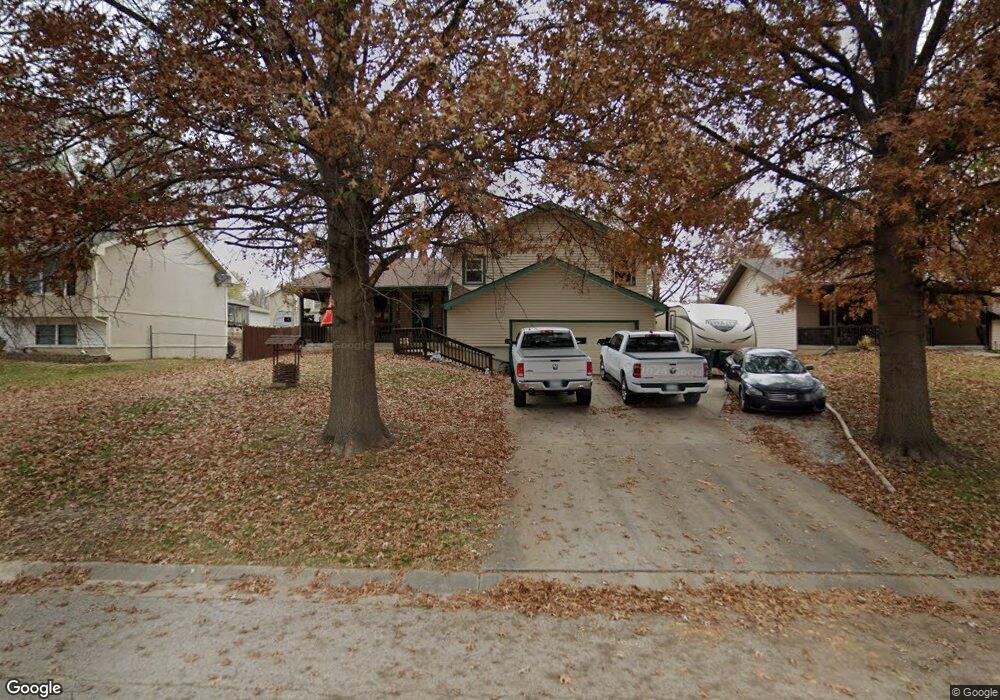
1010 N 3rd St Lansing, KS 66043
Estimated Value: $262,000 - $274,872
3
Beds
3
Baths
1,276
Sq Ft
$212/Sq Ft
Est. Value
About This Home
This home is located at 1010 N 3rd St, Lansing, KS 66043 and is currently estimated at $270,968, approximately $212 per square foot. 1010 N 3rd St is a home located in Leavenworth County with nearby schools including Lansing Elementary School, Lansing Middle 6-8, and Lansing High 9-12.
Ownership History
Date
Name
Owned For
Owner Type
Purchase Details
Closed on
Jun 1, 2001
Bought by
Phelps Johnny F and Phelps Rhonda A
Current Estimated Value
Home Financials for this Owner
Home Financials are based on the most recent Mortgage that was taken out on this home.
Original Mortgage
$153,420
Outstanding Balance
$115,485
Interest Rate
7.24%
Mortgage Type
FHA
Estimated Equity
$155,483
Create a Home Valuation Report for This Property
The Home Valuation Report is an in-depth analysis detailing your home's value as well as a comparison with similar homes in the area
Home Values in the Area
Average Home Value in this Area
Purchase History
| Date | Buyer | Sale Price | Title Company |
|---|---|---|---|
| Phelps Johnny F | $107,000 | -- |
Source: Public Records
Mortgage History
| Date | Status | Borrower | Loan Amount |
|---|---|---|---|
| Open | Phelps Johnny F | $153,420 | |
| Closed | Phelps Johnny F | $22,890 |
Source: Public Records
Tax History Compared to Growth
Tax History
| Year | Tax Paid | Tax Assessment Tax Assessment Total Assessment is a certain percentage of the fair market value that is determined by local assessors to be the total taxable value of land and additions on the property. | Land | Improvement |
|---|---|---|---|---|
| 2025 | $3,877 | $29,981 | $4,727 | $25,254 |
| 2024 | $3,612 | $29,099 | $3,715 | $25,384 |
| 2023 | $3,612 | $27,980 | $3,715 | $24,265 |
| 2022 | $3,377 | $24,748 | $3,015 | $21,733 |
| 2021 | $3,025 | $21,102 | $3,015 | $18,087 |
| 2020 | $2,856 | $19,619 | $3,404 | $16,215 |
| 2019 | $2,747 | $18,860 | $3,404 | $15,456 |
| 2018 | $2,581 | $17,745 | $3,404 | $14,341 |
| 2017 | $2,408 | $16,539 | $3,404 | $13,135 |
| 2016 | $2,385 | $16,376 | $2,987 | $13,389 |
| 2015 | $2,378 | $16,376 | $2,987 | $13,389 |
| 2014 | $2,329 | $16,376 | $2,870 | $13,506 |
Source: Public Records
Map
Nearby Homes
- 1100 N 4th St
- 1102 N 4th St
- 1102 N Main St
- 603 E Beth St
- 4 Eisenhower Rd
- 601 E Eisenhower Rd
- 268 Holiday Dr
- 129 Brookwood St
- 415 Fairlane St
- 129 Crestview Ct
- 218 Oak Hill St
- 20958 Ida St
- 310 E Kansas Ave
- 542 Creekside Ct
- 610 Meadowlark Rd
- 124 S Main St
- 202 S Main St
- 218 E Kay St
- 306 E Kay St
- 728 Eisenhower Rd