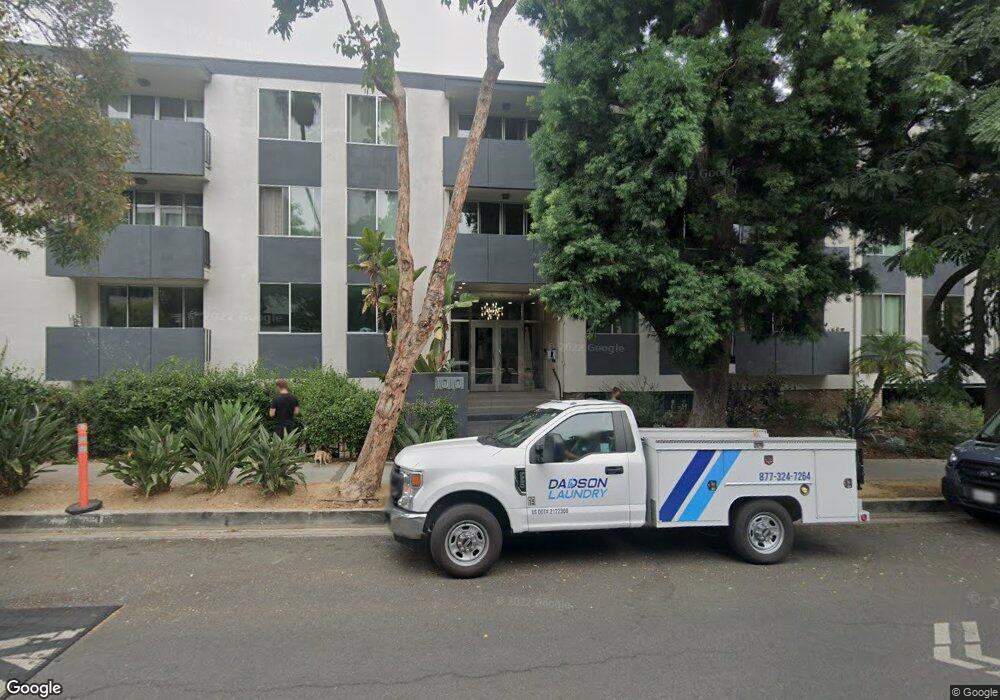
1010 N Kings Rd, Unit 316 West Hollywood, CA 90069
Estimated Value: $637,080 - $677,000
1
Bed
1
Bath
1,031
Sq Ft
$641/Sq Ft
Est. Value
About This Home
This home is located at 1010 N Kings Rd Unit 316, West Hollywood, CA 90069 and is currently estimated at $661,270, approximately $641 per square foot. 1010 N Kings Rd Unit 316 is a home located in Los Angeles County with nearby schools including Rosewood Avenue Elementary School, Hubert Howe Bancroft Middle School, and Fairfax High School.
Ownership History
Date
Name
Owned For
Owner Type
Purchase Details
Closed on
Apr 9, 2010
Sold by
Granof Leah Victoria and Levin David Ralph
Bought by
Green David P
Current Estimated Value
Home Financials for this Owner
Home Financials are based on the most recent Mortgage that was taken out on this home.
Original Mortgage
$390,791
Outstanding Balance
$259,505
Interest Rate
4.94%
Mortgage Type
FHA
Estimated Equity
$401,765
Purchase Details
Closed on
Mar 17, 2010
Sold by
Granof Leah Victoria and Levin David Ralph
Bought by
Granof Leah Victoria
Home Financials for this Owner
Home Financials are based on the most recent Mortgage that was taken out on this home.
Original Mortgage
$390,791
Outstanding Balance
$259,505
Interest Rate
4.94%
Mortgage Type
FHA
Estimated Equity
$401,765
Purchase Details
Closed on
Jan 3, 1996
Sold by
Levin David and Levin Carol
Bought by
Levin David
Purchase Details
Closed on
Dec 19, 1995
Sold by
Levin Victoria R
Bought by
Levin Victoria R and Victoria Rachel Levin Trust
Create a Home Valuation Report for This Property
The Home Valuation Report is an in-depth analysis detailing your home's value as well as a comparison with similar homes in the area
Home Values in the Area
Average Home Value in this Area
Purchase History
| Date | Buyer | Sale Price | Title Company |
|---|---|---|---|
| Green David P | $398,000 | Lawyers Title | |
| Granof Leah Victoria | -- | None Available | |
| Levin David | -- | -- | |
| Levin Victoria R | -- | -- |
Source: Public Records
Mortgage History
| Date | Status | Borrower | Loan Amount |
|---|---|---|---|
| Open | Green David P | $390,791 |
Source: Public Records
Tax History Compared to Growth
Tax History
| Year | Tax Paid | Tax Assessment Tax Assessment Total Assessment is a certain percentage of the fair market value that is determined by local assessors to be the total taxable value of land and additions on the property. | Land | Improvement |
|---|---|---|---|---|
| 2025 | $6,354 | $513,731 | $372,651 | $141,080 |
| 2024 | $6,354 | $503,659 | $365,345 | $138,314 |
| 2023 | $6,251 | $493,784 | $358,182 | $135,602 |
| 2022 | $5,940 | $484,103 | $351,159 | $132,944 |
| 2021 | $5,906 | $474,612 | $344,274 | $130,338 |
| 2019 | $5,714 | $460,536 | $334,063 | $126,473 |
| 2018 | $5,674 | $451,507 | $327,513 | $123,994 |
| 2016 | $5,435 | $433,977 | $314,797 | $119,180 |
| 2015 | $5,350 | $427,459 | $310,069 | $117,390 |
| 2014 | $5,352 | $419,087 | $303,996 | $115,091 |
Source: Public Records
About This Building
Map
Nearby Homes
- 1010 N Kings Rd Unit 218
- 1030 N Kings Rd Unit 306
- 1030 N Kings Rd Unit 407
- 1025 N Kings Rd Unit 113
- 1025 N Kings Rd Unit 105
- 1045 N Kings Rd Unit 105
- 949 N Kings Rd Unit 314
- 950 N Kings Rd Unit 233
- 950 N Kings Rd Unit 245
- 950 N Kings Rd Unit 315
- 950 N Kings Rd Unit 204
- 950 N Kings Rd Unit 208
- 950 N Kings Rd Unit 160
- 927 N Kings Rd Unit 212
- 927 N Kings Rd Unit 107
- 927 N Kings Rd Unit 113
- 1041 N Orlando Ave
- 1016 N Harper Ave
- 911 N Kings Rd Unit 319
- 1200 N Flores St Unit 309
- 1010 N Kings Rd Unit 103
- 1010 N Kings Rd Unit 104
- 1010 N Kings Rd Unit 113
- 1010 N Kings Rd Unit 112
- 1010 N Kings Rd Unit 111
- 1010 N Kings Rd Unit 110
- 1010 N Kings Rd Unit 109
- 1010 N Kings Rd Unit 108
- 1010 N Kings Rd Unit 107
- 1010 N Kings Rd Unit 106
- 1010 N Kings Rd Unit 102
- 1010 N Kings Rd Unit 101
- 1010 N Kings Rd Unit 318
- 1010 N Kings Rd Unit 317
- 1010 N Kings Rd Unit 315
- 1010 N Kings Rd Unit 313
- 1010 N Kings Rd Unit 312
- 1010 N Kings Rd Unit 311
- 1010 N Kings Rd Unit 310
- 1010 N Kings Rd Unit 211