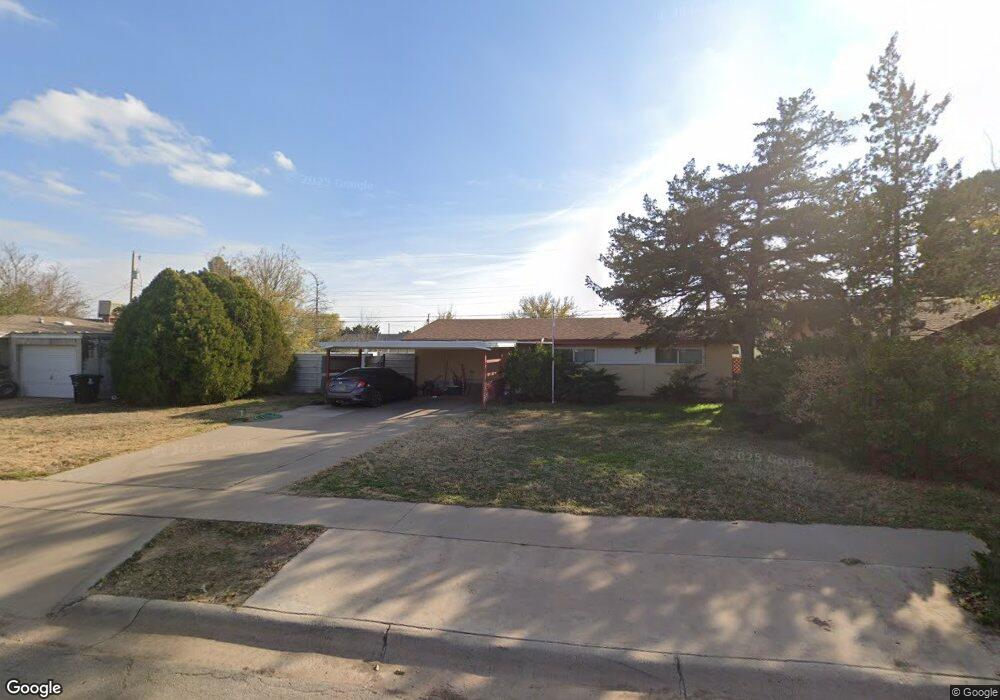
1010 N Plains Park Dr Roswell, NM 88203
Estimated Value: $116,000 - $157,000
--
Bed
--
Bath
1,215
Sq Ft
$115/Sq Ft
Est. Value
About This Home
This home is located at 1010 N Plains Park Dr, Roswell, NM 88203 and is currently estimated at $139,227, approximately $114 per square foot. 1010 N Plains Park Dr is a home located in Chaves County with nearby schools including Valley View Elementary School, Sierra Middle School, and Roswell High School.
Ownership History
Date
Name
Owned For
Owner Type
Purchase Details
Closed on
Apr 7, 2022
Sold by
Dollar Garrett J
Bought by
Candelaria Jerod E
Current Estimated Value
Home Financials for this Owner
Home Financials are based on the most recent Mortgage that was taken out on this home.
Original Mortgage
$133,000
Outstanding Balance
$125,530
Interest Rate
4.72%
Mortgage Type
FHA
Estimated Equity
$13,697
Purchase Details
Closed on
Sep 6, 2017
Sold by
Siepker Ronald W and Siepker Joyece A
Bought by
Dollar Garrett J
Home Financials for this Owner
Home Financials are based on the most recent Mortgage that was taken out on this home.
Original Mortgage
$72,750
Interest Rate
3.92%
Mortgage Type
New Conventional
Purchase Details
Closed on
Jan 25, 2010
Sold by
Siepker Joyce
Bought by
Siepker Ronald W and Siepker Joyce A
Create a Home Valuation Report for This Property
The Home Valuation Report is an in-depth analysis detailing your home's value as well as a comparison with similar homes in the area
Home Values in the Area
Average Home Value in this Area
Purchase History
| Date | Buyer | Sale Price | Title Company |
|---|---|---|---|
| Candelaria Jerod E | -- | None Listed On Document | |
| Dollar Garrett J | -- | Landmark Title Co Will Pick | |
| Siepker Ronald W | -- | Lawyers Title |
Source: Public Records
Mortgage History
| Date | Status | Borrower | Loan Amount |
|---|---|---|---|
| Open | Candelaria Jerod E | $133,000 | |
| Previous Owner | Dollar Garrett J | $72,750 | |
| Closed | Candelaria Jerod E | $6,639 |
Source: Public Records
Tax History Compared to Growth
Tax History
| Year | Tax Paid | Tax Assessment Tax Assessment Total Assessment is a certain percentage of the fair market value that is determined by local assessors to be the total taxable value of land and additions on the property. | Land | Improvement |
|---|---|---|---|---|
| 2025 | $1,023 | $38,751 | $2,333 | $36,418 |
| 2024 | $1,023 | $37,622 | $2,333 | $35,289 |
| 2023 | $1,026 | $36,527 | $2,333 | $34,194 |
| 2022 | $620 | $22,310 | $2,333 | $19,977 |
| 2021 | $616 | $21,660 | $2,333 | $19,327 |
| 2020 | $605 | $21,273 | $2,333 | $18,940 |
| 2019 | $623 | $21,955 | $2,333 | $19,622 |
| 2018 | $604 | $21,316 | $2,333 | $18,983 |
| 2017 | $303 | $19,367 | $2,106 | $17,261 |
| 2016 | $283 | $18,802 | $2,049 | $16,753 |
| 2015 | $292 | $18,255 | $2,005 | $16,250 |
| 2014 | $552 | $17,723 | $1,963 | $15,760 |
Source: Public Records
Map
Nearby Homes
- 1012 S Plains Park Dr
- 1028 Clover Ln
- 0 S Union Ave
- 000 S Union Ave
- 1006 W Hobbs St
- 1000 Fern Dr
- 305 S Sunset Ave
- 1009 Ivy Dr
- 1002 Plaza Del Sol
- 705 N Plains Park Dr
- 1034 Ivy Dr
- 1614 Mesa Dr
- 1907 S Washington Ave
- 503 W Hervey Dr
- 5 Wildy Dr
- 609 W Gayle St
- 600 Barnett Dr
- 704 W Gayle St
- 1202 Baylor Dr
- 1516 S Kentucky Ave
- 1012 N Plains Park Dr
- 1008 N Plains Park Dr
- 1011 S Plains Park Dr
- 1009 S Plains Park Dr
- 1013 S Plains Park Dr
- 1014 N Plains Park Dr
- 1006 N Plains Park Dr
- 1013 N Plains Park Dr
- 1011 N Plains Park Dr
- 1015 N Plains Park Dr
- 1007 S Plains Park Dr
- 1009 N Plains Park Dr
- 1015 S Plains Park Dr
- 1004 N Plains Park Dr
- 1017 N Plains Park Dr
- 1007 N Plains Park Dr
- 1005 S Plains Park Dr
- 1017 S Plains Park Dr
- 1019 N Plains Park Dr
- 1005 N Plains Park Dr