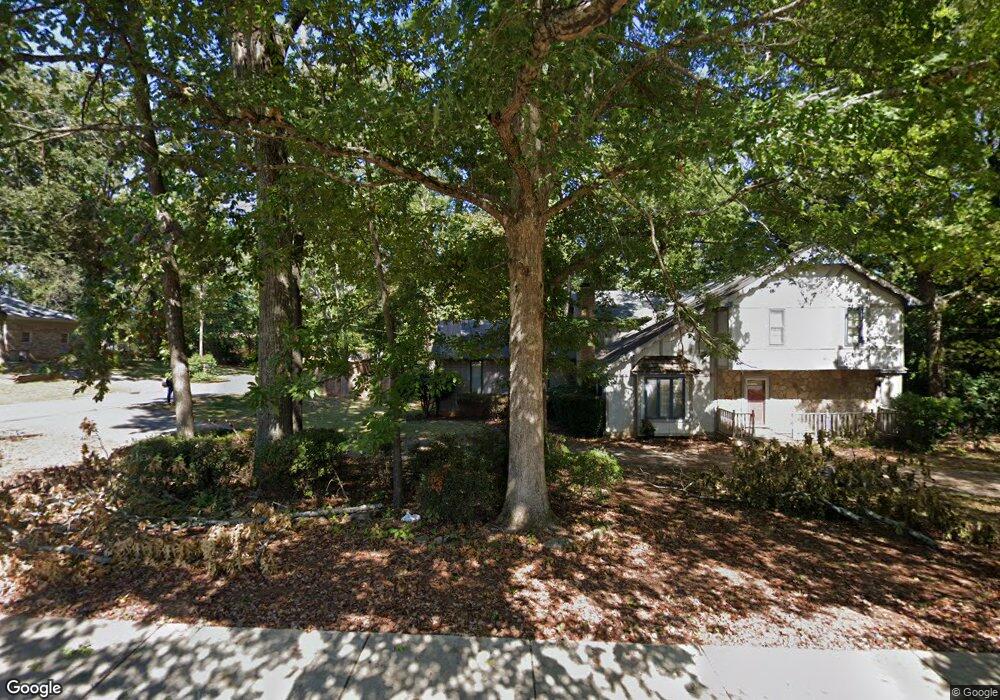
1010 Pair Rd SW Marietta, GA 30060
Southwestern Marietta NeighborhoodEstimated Value: $428,000 - $552,000
5
Beds
4
Baths
4,482
Sq Ft
$106/Sq Ft
Est. Value
About This Home
This home is located at 1010 Pair Rd SW, Marietta, GA 30060 and is currently estimated at $475,021, approximately $105 per square foot. 1010 Pair Rd SW is a home located in Cobb County with nearby schools including Birney Elementary School, Floyd Middle School, and Osborne High School.
Ownership History
Date
Name
Owned For
Owner Type
Purchase Details
Closed on
Sep 30, 2011
Sold by
Young Douglas S
Bought by
Allison Cyril
Current Estimated Value
Home Financials for this Owner
Home Financials are based on the most recent Mortgage that was taken out on this home.
Original Mortgage
$141,324
Outstanding Balance
$96,732
Interest Rate
4.25%
Mortgage Type
FHA
Estimated Equity
$378,289
Purchase Details
Closed on
May 14, 2010
Sold by
Aurora Ln Svcs Llc
Bought by
Young Douglas S and Young Alicia P
Purchase Details
Closed on
Aug 4, 2009
Sold by
Olivier Marie
Bought by
Aurora Ln Svcs Llc
Purchase Details
Closed on
Jan 7, 2004
Sold by
Price Allison and Price Jeanette
Bought by
Olivier Marie
Home Financials for this Owner
Home Financials are based on the most recent Mortgage that was taken out on this home.
Original Mortgage
$237,500
Interest Rate
5.87%
Mortgage Type
New Conventional
Purchase Details
Closed on
Oct 23, 1996
Sold by
Ramsdell Robert W Amanda F
Bought by
Price Allison Jeanette
Create a Home Valuation Report for This Property
The Home Valuation Report is an in-depth analysis detailing your home's value as well as a comparison with similar homes in the area
Home Values in the Area
Average Home Value in this Area
Purchase History
| Date | Buyer | Sale Price | Title Company |
|---|---|---|---|
| Allison Cyril | $145,000 | -- | |
| Young Douglas S | $141,000 | -- | |
| Aurora Ln Svcs Llc | $316,581 | -- | |
| Olivier Marie | $250,000 | -- | |
| Price Allison Jeanette | $206,000 | -- |
Source: Public Records
Mortgage History
| Date | Status | Borrower | Loan Amount |
|---|---|---|---|
| Open | Allison Cyril | $141,324 | |
| Previous Owner | Olivier Marie | $237,500 |
Source: Public Records
Tax History Compared to Growth
Tax History
| Year | Tax Paid | Tax Assessment Tax Assessment Total Assessment is a certain percentage of the fair market value that is determined by local assessors to be the total taxable value of land and additions on the property. | Land | Improvement |
|---|---|---|---|---|
| 2025 | $5,181 | $231,752 | $30,000 | $201,752 |
| 2024 | $3,831 | $169,312 | $18,000 | $151,312 |
| 2023 | $3,288 | $169,312 | $18,000 | $151,312 |
| 2022 | $3,863 | $169,312 | $18,000 | $151,312 |
| 2021 | $3,863 | $169,312 | $18,000 | $151,312 |
| 2020 | $2,917 | $126,080 | $18,000 | $108,080 |
| 2019 | $2,917 | $126,080 | $18,000 | $108,080 |
| 2018 | $3,579 | $156,340 | $18,000 | $138,340 |
| 2017 | $1,690 | $72,888 | $13,600 | $59,288 |
| 2016 | $1,619 | $69,512 | $13,600 | $55,912 |
| 2015 | $1,655 | $69,512 | $13,600 | $55,912 |
Source: Public Records
Map
Nearby Homes
- 3141 Holbrook Dr SW
- 1108 Byers Dr SW
- 959 Old Milford Church Rd SW
- 825 Winfield Ct SW
- 3004 Michael Dr SW
- 1020 Hicksmil Dr SW
- 800 Grindstone Place SW
- 2940 Caller Ct SW
- 3355 Carolina Wren Trail SW
- 971 Canyon Trail SW
- 3337 Mill Stream Ln SW
- 760 Stone Harbor Pkwy SW
- 2907 Crest Ridge Ct SW
- 2964 Edgemont Ln SW
- 3309 Raes Creek Rd Unit 13
- 1086 Mornington Way
- 1308 Willamette Way
- 1004 Pair Rd SW
- 3140 Oakton Way SW
- 3162 Chisholm Trail SW Unit 3
- 3162 Chisholm Trail SW
- 1025 Pair Rd SW
- 1017 Oakton Dr SW
- 3120 Oakton Way SW
- 990 Pair Rd SW
- 991 Pair Rd SW
- 1005 Oakton Dr SW Unit 2
- 1040 Pair Rd SW
- 3174 Chisholm Trail SW Unit 2
- 997 Oakton Dr SW
- 1041 Pair Rd SW
- 3110 Oakton Way SW
- 975 Pair Rd SW
- 974 Pair Rd SW
- 979 Oakton Dr SW Unit 2
- 3177 Chisholm Trail SW
- 1015 Frontier Trail SW