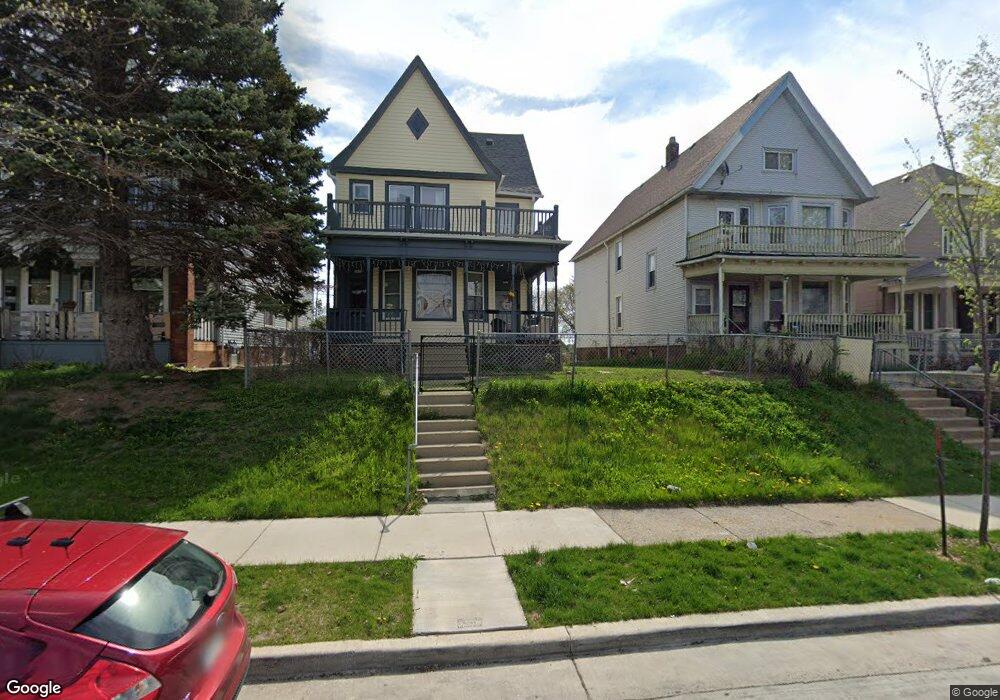
1010 S 32nd St Unit 1012 Milwaukee, WI 53215
Silver City NeighborhoodEstimated Value: $211,000 - $250,000
4
Beds
2
Baths
2,481
Sq Ft
$89/Sq Ft
Est. Value
About This Home
This home is located at 1010 S 32nd St Unit 1012, Milwaukee, WI 53215 and is currently estimated at $221,292, approximately $89 per square foot. 1010 S 32nd St Unit 1012 is a home located in Milwaukee County with nearby schools including Doerfler School, Milwaukee Spanish Immersion School - Upper Campus, and Milwaukee German Immersion School.
Ownership History
Date
Name
Owned For
Owner Type
Purchase Details
Closed on
May 25, 2010
Sold by
Fannie Mae
Bought by
Shlyakhetko Ruslan and Pyatetskaya Yelena
Current Estimated Value
Purchase Details
Closed on
Feb 9, 2010
Sold by
Yang Mao and Yang Pang Ma
Bought by
Federal National Mortgage Association
Purchase Details
Closed on
Mar 29, 2004
Sold by
Fannie Mae
Bought by
Yang Pang Ma and Yang Mao
Home Financials for this Owner
Home Financials are based on the most recent Mortgage that was taken out on this home.
Original Mortgage
$45,450
Interest Rate
5.66%
Mortgage Type
Purchase Money Mortgage
Purchase Details
Closed on
Jan 20, 2004
Sold by
Pinto Javier N
Bought by
Federal National Mortgage Association
Create a Home Valuation Report for This Property
The Home Valuation Report is an in-depth analysis detailing your home's value as well as a comparison with similar homes in the area
Home Values in the Area
Average Home Value in this Area
Purchase History
| Date | Buyer | Sale Price | Title Company |
|---|---|---|---|
| Shlyakhetko Ruslan | -- | None Available | |
| Federal National Mortgage Association | -- | None Available | |
| Yang Pang Ma | -- | -- | |
| Federal National Mortgage Association | -- | -- |
Source: Public Records
Mortgage History
| Date | Status | Borrower | Loan Amount |
|---|---|---|---|
| Previous Owner | Yang Pang Ma | $45,450 |
Source: Public Records
Tax History Compared to Growth
Tax History
| Year | Tax Paid | Tax Assessment Tax Assessment Total Assessment is a certain percentage of the fair market value that is determined by local assessors to be the total taxable value of land and additions on the property. | Land | Improvement |
|---|---|---|---|---|
| 2024 | $3,533 | $157,900 | $9,300 | $148,600 |
| 2023 | $3,124 | $132,200 | $9,300 | $122,900 |
| 2022 | $3,110 | $132,200 | $9,300 | $122,900 |
| 2021 | $2,976 | $115,900 | $9,300 | $106,600 |
| 2020 | $3,023 | $115,900 | $9,300 | $106,600 |
| 2019 | $3,026 | $109,200 | $9,500 | $99,700 |
| 2018 | $2,758 | $109,200 | $9,500 | $99,700 |
| 2017 | $2,686 | $101,100 | $9,300 | $91,800 |
| 2016 | $2,876 | $100,400 | $9,300 | $91,100 |
| 2015 | -- | $102,400 | $9,300 | $93,100 |
| 2014 | -- | $109,000 | $9,300 | $99,700 |
| 2013 | -- | $109,000 | $9,300 | $99,700 |
Source: Public Records
Map
Nearby Homes
- 1115 S 33rd St
- 926 S 35th St
- 734 S 30th St
- 3131 W Madison St
- 1009 S 35th St
- 1117 S Layton Blvd Unit 1119
- 1133 S Layton Blvd
- 1226 S 28th St
- 708 S 36th St Unit 710
- 3006 W Orchard St
- 1257 S 36th St
- 1428 S 35th St
- 1509 S 33rd St
- 3719 W Frederica Place
- 663 S Layton Blvd
- 1326 S 37th St
- 3731 W Dorothy Place
- 3208 W Lapham St
- 1546 S Layton Blvd
- 1606 S 35th St
- 1016 S 32nd St Unit 1018
- 1004 S 32nd St Unit 1006
- 1020 S 32nd St
- 1002 S 32nd St
- 1024 S 32nd St Unit 1026
- 934 S 32nd St
- 1028 S 32nd St
- 1011 S 31st St
- 1019 S 31st St
- 1032 S 32nd St
- 1007 S 31st St
- 1023 S 31st St
- 1003 S 31st St
- 928 S 32nd St
- 1027 S 31st St
- 1036 S 32nd St
- 941 S 31st St
- 1011 S 32nd St Unit 1013
- 1009 S 32nd St
- 1019 S 32nd St