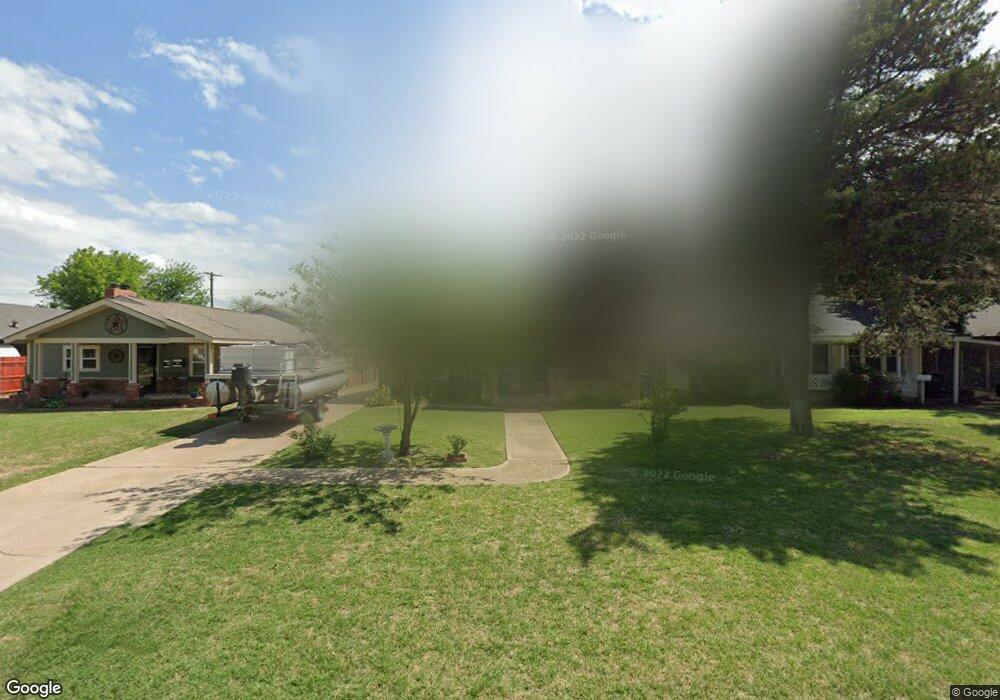
1010 W Chestnut Ave Duncan, OK 73533
Estimated Value: $120,000 - $153,000
2
Beds
1
Bath
2,114
Sq Ft
$62/Sq Ft
Est. Value
About This Home
This home is located at 1010 W Chestnut Ave, Duncan, OK 73533 and is currently estimated at $131,828, approximately $62 per square foot. 1010 W Chestnut Ave is a home located in Stephens County with nearby schools including Emerson Elementary School, Duncan Middle School, and Duncan High School.
Ownership History
Date
Name
Owned For
Owner Type
Purchase Details
Closed on
May 17, 2021
Sold by
Shondelmyer Richard and Shondelmyer Donetta
Bought by
Bell Douglas R and Bell Karen J
Current Estimated Value
Home Financials for this Owner
Home Financials are based on the most recent Mortgage that was taken out on this home.
Original Mortgage
$29,000
Outstanding Balance
$17,290
Interest Rate
3.1%
Mortgage Type
Future Advance Clause Open End Mortgage
Estimated Equity
$114,538
Purchase Details
Closed on
Jan 2, 2014
Sold by
Stevenson Gecrge T and Martelly Melissa
Bought by
Bell Douglas R and Bell Karen J
Purchase Details
Closed on
Oct 25, 2013
Sold by
Stevenson George T
Bought by
Bell Douglas R and Bell Karen J
Purchase Details
Closed on
May 9, 2008
Sold by
Bell Douglas R and Bell Karen J
Bought by
Stevenson George T
Create a Home Valuation Report for This Property
The Home Valuation Report is an in-depth analysis detailing your home's value as well as a comparison with similar homes in the area
Purchase History
| Date | Buyer | Sale Price | Title Company |
|---|---|---|---|
| Bell Douglas R | $29,000 | Stephens Co Abstract Co | |
| Bell Douglas R | -- | None Available | |
| Bell Douglas R | -- | None Available | |
| Stevenson George T | $75,000 | None Available |
Source: Public Records
Mortgage History
| Date | Status | Borrower | Loan Amount |
|---|---|---|---|
| Open | Bell Douglas R | $29,000 |
Source: Public Records
Tax History
| Year | Tax Paid | Tax Assessment Tax Assessment Total Assessment is a certain percentage of the fair market value that is determined by local assessors to be the total taxable value of land and additions on the property. | Land | Improvement |
|---|---|---|---|---|
| 2025 | $600 | $8,117 | $500 | $7,617 |
| 2024 | $567 | $7,652 | $475 | $7,177 |
| 2023 | $567 | $7,651 | $475 | $7,176 |
| 2022 | $528 | $7,429 | $473 | $6,956 |
| 2021 | $529 | $7,212 | $473 | $6,739 |
| 2020 | $501 | $6,798 | $468 | $6,330 |
| 2019 | $485 | $6,601 | $463 | $6,138 |
| 2018 | $482 | $6,600 | $463 | $6,137 |
| 2017 | $449 | $6,408 | $456 | $5,952 |
| 2016 | $428 | $6,041 | $442 | $5,599 |
| 2015 | $461 | $5,865 | $435 | $5,430 |
| 2014 | $461 | $5,694 | $428 | $5,266 |
Source: Public Records
Map
Nearby Homes
- 915 W Chestnut Ave
- 1106 W Ash Ave
- 1037 W Hickory Ave
- 809 W Beech Ave
- 1275 N 10th St
- 1309 W Beech Ave
- 1314 W Beech Ave
- 905 W Pine Ave
- 1203 W Walnut Ave
- 0 Alaska Unit 2602709
- 27 N 14th St
- 722 N 8th St
- 1408 W Walnut Ave
- 123 N Highway 81
- 512 W Oak Ave
- 512 W Pine Ave
- 1309 W Spruce Ave
- 1315 W Spruce Ave
- 1705 W Ash Ave
- 1061 N 8th St
- 1012 W Chestnut Ave
- 1008 W Chestnut Ave
- 1014 W Chestnut Ave
- 1006 W Chestnut Ave
- 1013 W Beech Ave
- 1004 W Chestnut Ave
- 1009 W Beech Ave
- 1015 W Beech Ave
- 1102 W Chestnut Ave
- 1015 1015 W Chestnut
- 407 N 10th St
- 405 N 10th St
- 1011 W Chestnut Ave
- 1009 W Chestnut Ave
- 1015 W Chestnut Ave
- 1007 W Chestnut Ave
- 1104 W Chestnut Ave Unit 12
- 1104 W Chestnut Ave
- 1101 W Beech Ave
- 1005 W Chestnut Ave
Your Personal Tour Guide
Ask me questions while you tour the home.