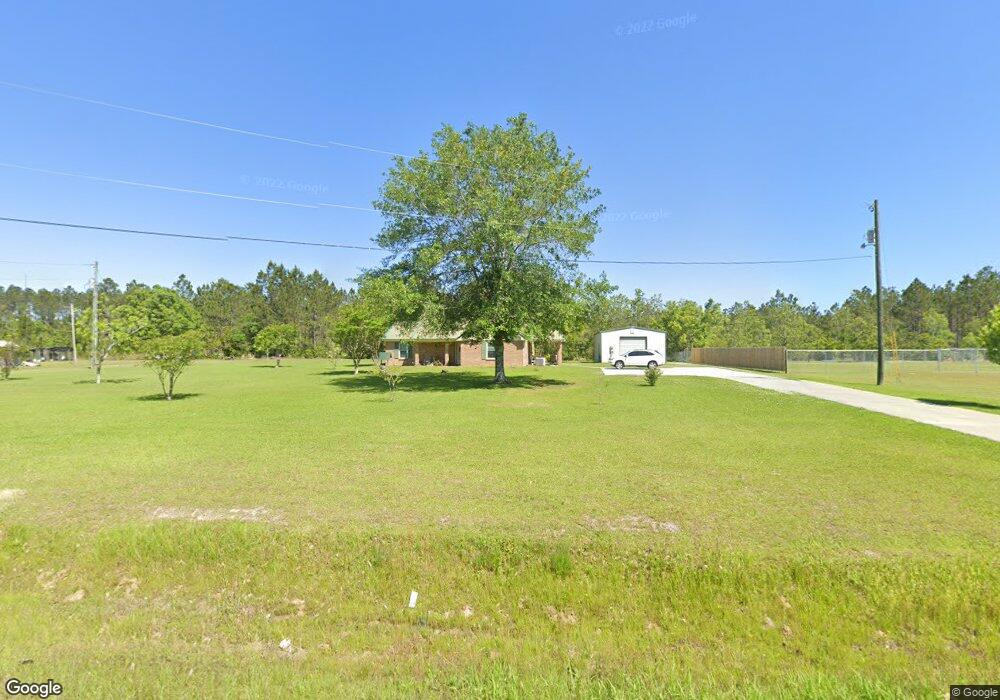
10101 Seaman Rd Vancleave, MS 39565
Estimated Value: $174,621 - $279,000
--
Bed
2
Baths
1,265
Sq Ft
$190/Sq Ft
Est. Value
About This Home
This home is located at 10101 Seaman Rd, Vancleave, MS 39565 and is currently estimated at $240,905, approximately $190 per square foot. 10101 Seaman Rd is a home located in Jackson County with nearby schools including St Martin East Elementary School, St Martin North Elementary School, and St Martin Upper Elementary School.
Ownership History
Date
Name
Owned For
Owner Type
Purchase Details
Closed on
Oct 28, 2011
Sold by
Oquendo Robert and Bond Tina
Bought by
Oneal Rebecca L and Oneal David Thomas
Current Estimated Value
Create a Home Valuation Report for This Property
The Home Valuation Report is an in-depth analysis detailing your home's value as well as a comparison with similar homes in the area
Home Values in the Area
Average Home Value in this Area
Purchase History
| Date | Buyer | Sale Price | Title Company |
|---|---|---|---|
| Oneal Rebecca L | -- | Pilger Title Company |
Source: Public Records
Tax History Compared to Growth
Tax History
| Year | Tax Paid | Tax Assessment Tax Assessment Total Assessment is a certain percentage of the fair market value that is determined by local assessors to be the total taxable value of land and additions on the property. | Land | Improvement |
|---|---|---|---|---|
| 2024 | $13 | $9,105 | $1,862 | $7,243 |
| 2023 | $13 | $9,105 | $1,862 | $7,243 |
| 2022 | $13 | $7,611 | $0 | $0 |
| 2021 | $13 | $7,611 | $7,611 | $0 |
| 2020 | $13 | $7,611 | $1,433 | $6,178 |
| 2019 | $13 | $7,611 | $1,433 | $6,178 |
| 2018 | $14 | $7,611 | $1,433 | $6,178 |
| 2017 | $14 | $7,611 | $1,433 | $6,178 |
| 2016 | $13 | $7,611 | $1,433 | $6,178 |
| 2015 | -- | $68,930 | $12,030 | $56,900 |
| 2014 | -- | $7,096 | $1,203 | $5,893 |
| 2013 | -- | $7,096 | $1,203 | $5,893 |
Source: Public Records
Map
Nearby Homes
- 0 Muszar Ln
- 0 Maple Cove
- 13221 Sunview Cove
- 13601 Virginia St
- 13505 Sarus Dr
- The Camden Plan at Crane Landing
- The Jasmine Plan at Crane Landing
- The Destin Plan at Crane Landing
- The Hawthorne Plan at Crane Landing
- The Holly Plan at Crane Landing
- 13509 Sarus Dr
- 13521 Sarus Dr
- 13517 Sarus Dr
- 13461 Crane Dr
- 13465 Crane Dr
- 13412 Crane Dr
- 13457 Crane Dr
- 13445 Crane Dr
- 13409 Crane Dr
- 13441 Crane Dr
- 10105 Seaman Rd
- 10017 Seaman Rd
- 10011 Seaman Rd
- 10113 Seaman Rd
- 10001 Muszar Ln
- 12927 Hebert Cove
- 12926 Hebert Cove
- 12926 Hebert Cove
- 10358 Lake Forest Dr
- 10354 Lake Forest Dr
- 10350 Lake Forest Dr
- 12931 Hebert Cove
- 12930 Hebert Cove
- 10346 Lake Forest Dr
- 10064 Ponderosa Place
- 10210 Muszar Ln
- 12935 Hebert Cove
- 12935 Hebert Cove
- 12934 Hebert Cove
- 10351 Lake Forest Dr