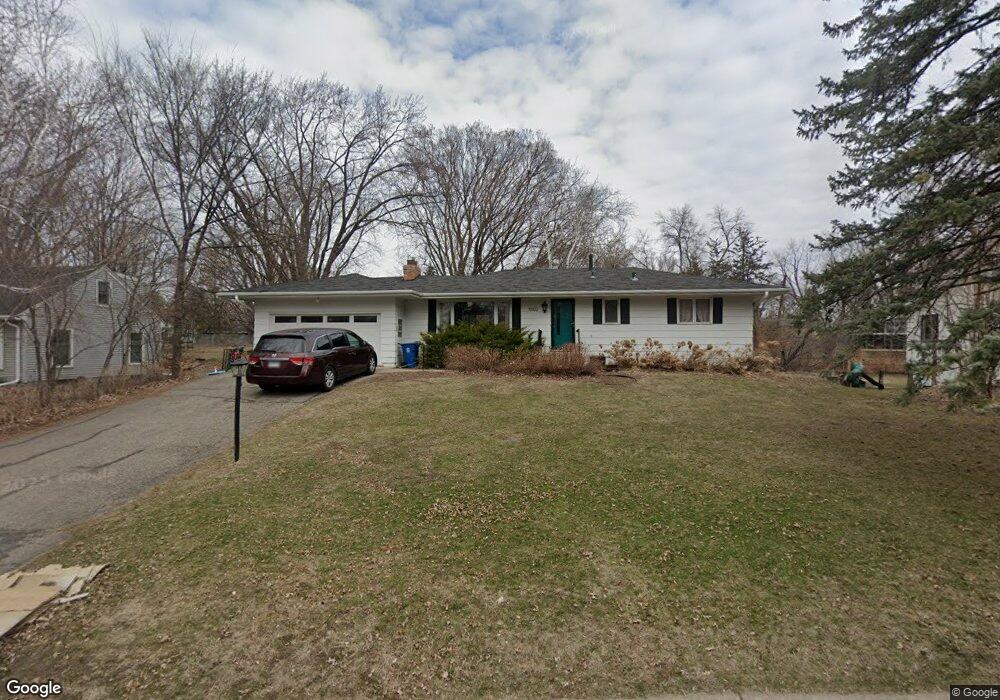
10102 Belmont Rd Hopkins, MN 55305
Estimated Value: $423,000 - $466,308
4
Beds
2
Baths
1,170
Sq Ft
$378/Sq Ft
Est. Value
About This Home
This home is located at 10102 Belmont Rd, Hopkins, MN 55305 and is currently estimated at $442,577, approximately $378 per square foot. 10102 Belmont Rd is a home located in Hennepin County with nearby schools including L.H. Tanglen Elementary School, Hopkins North Junior High School, and Hopkins Senior High School.
Ownership History
Date
Name
Owned For
Owner Type
Purchase Details
Closed on
Jan 5, 2023
Sold by
Jorgensen Hannah Marie and Jorgensen Jeffrey
Bought by
Jorgensen Hannah Marie and Jorgensen Jeffrey
Current Estimated Value
Home Financials for this Owner
Home Financials are based on the most recent Mortgage that was taken out on this home.
Original Mortgage
$305,000
Outstanding Balance
$295,377
Interest Rate
6.49%
Mortgage Type
New Conventional
Estimated Equity
$147,200
Purchase Details
Closed on
Nov 18, 2015
Sold by
Sivanich Michael D
Bought by
Mullen Schultz Hannah and Jorgensen Jeffrey
Home Financials for this Owner
Home Financials are based on the most recent Mortgage that was taken out on this home.
Original Mortgage
$232,655
Interest Rate
3.75%
Mortgage Type
New Conventional
Purchase Details
Closed on
May 16, 2007
Sold by
Sivanich Michael C and Sivanich Florence A
Bought by
Sivanich Michael C and Sivanich Florence A
Create a Home Valuation Report for This Property
The Home Valuation Report is an in-depth analysis detailing your home's value as well as a comparison with similar homes in the area
Home Values in the Area
Average Home Value in this Area
Purchase History
| Date | Buyer | Sale Price | Title Company |
|---|---|---|---|
| Jorgensen Hannah Marie | $323 | -- | |
| Mullen Schultz Hannah | $244,900 | Attorney | |
| Sivanich Michael C | -- | Attorney |
Source: Public Records
Mortgage History
| Date | Status | Borrower | Loan Amount |
|---|---|---|---|
| Open | Jorgensen Hannah Marie | $305,000 | |
| Previous Owner | Mullen Schultz Hannah | $232,655 |
Source: Public Records
Tax History Compared to Growth
Tax History
| Year | Tax Paid | Tax Assessment Tax Assessment Total Assessment is a certain percentage of the fair market value that is determined by local assessors to be the total taxable value of land and additions on the property. | Land | Improvement |
|---|---|---|---|---|
| 2024 | $4,866 | $405,600 | $202,400 | $203,200 |
| 2023 | $4,352 | $371,500 | $202,400 | $169,100 |
| 2022 | $3,791 | $362,600 | $202,400 | $160,200 |
| 2021 | $3,533 | $310,000 | $184,000 | $126,000 |
| 2020 | $3,661 | $294,400 | $184,000 | $110,400 |
| 2019 | $3,478 | $289,600 | $184,000 | $105,600 |
| 2018 | $3,228 | $278,800 | $184,000 | $94,800 |
| 2017 | $3,215 | $248,500 | $165,000 | $83,500 |
| 2016 | $3,310 | $248,500 | $155,000 | $93,500 |
| 2015 | $3,232 | $238,700 | $150,000 | $88,700 |
| 2014 | -- | $219,000 | $150,000 | $69,000 |
Source: Public Records
Map
Nearby Homes
- 10003 Crestridge Dr
- TBD Lakeview Dr W
- 10408 Belmont Rd
- 1155 Ford Rd Unit 201
- 1155 Ford Rd Unit 402
- 1155 Ford Rd Unit 205
- 1155 Ford Rd Unit 504
- 1155 Ford Rd Unit 513
- 1155 Ford Rd Unit 414
- 1155 Ford Rd Unit 405
- 1155 Ford Rd Unit 203
- 1155 Ford Rd Unit 214
- 1155 Ford Rd Unit 314
- 1155 Ford Rd Unit 501
- 1155 Ford Rd Unit 512
- 10605 Crestridge Dr
- 10309 Lakeview Dr W
- 1411 Archwood Rd
- 450 Ford Rd Unit 225
- 450 Ford Rd Unit 227
- 10112 Belmont Rd
- 10008 Belmont Rd
- 10101 Crestridge Dr
- 10116 Belmont Rd
- 10105 Crestridge Dr
- 10007 Crestridge Dr
- 10009 Belmont Rd
- 1417 Yorkshire Ave S
- 1424 Ford Rd
- 1416 Ford Rd
- 1411 Yorkshire Ave S
- 10105 Belmont Rd
- 1405 Yorkshire Ave S
- 10120 Belmont Rd
- 1500 Ford Rd
- 1401 Yorkshire Ave S
- 10113 Belmont Rd
- 10001 Crestridge Dr
- 1508 Ford Rd
- 10123 Belmont Rd