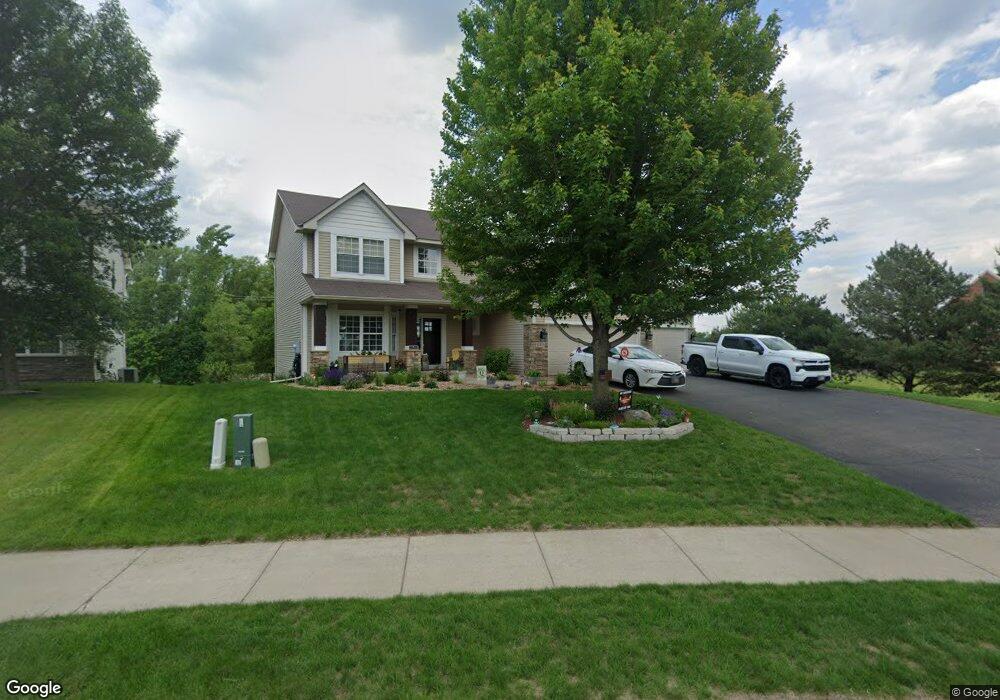
10103 192nd Ln NW Elk River, MN 55330
Estimated Value: $451,000 - $483,000
4
Beds
3
Baths
1,277
Sq Ft
$362/Sq Ft
Est. Value
About This Home
This home is located at 10103 192nd Ln NW, Elk River, MN 55330 and is currently estimated at $462,439, approximately $362 per square foot. 10103 192nd Ln NW is a home located in Sherburne County with nearby schools including Twin Lakes Elementary School, Salk Middle School, and Elk River Senior High School.
Ownership History
Date
Name
Owned For
Owner Type
Purchase Details
Closed on
Jul 30, 2018
Sold by
Cain John William and Cain Maria
Bought by
Quesenberry Tyler and Quesenberry Sarah
Current Estimated Value
Home Financials for this Owner
Home Financials are based on the most recent Mortgage that was taken out on this home.
Original Mortgage
$3,078,867
Outstanding Balance
$2,673,871
Interest Rate
4.5%
Mortgage Type
VA
Estimated Equity
-$2,211,432
Purchase Details
Closed on
Oct 30, 2014
Sold by
Carlson Samuel T and Carlson Sandra L
Bought by
Cain John William
Home Financials for this Owner
Home Financials are based on the most recent Mortgage that was taken out on this home.
Original Mortgage
$255,375
Interest Rate
4.21%
Mortgage Type
VA
Purchase Details
Closed on
Jan 18, 2006
Sold by
Fmm Family Ltd Liability Lp
Bought by
U S Home Corp
Create a Home Valuation Report for This Property
The Home Valuation Report is an in-depth analysis detailing your home's value as well as a comparison with similar homes in the area
Home Values in the Area
Average Home Value in this Area
Purchase History
| Date | Buyer | Sale Price | Title Company |
|---|---|---|---|
| Quesenberry Tyler | -- | None Available | |
| Cain John William | $250,000 | Burnet Title | |
| U S Home Corp | $3,198,267 | -- |
Source: Public Records
Mortgage History
| Date | Status | Borrower | Loan Amount |
|---|---|---|---|
| Open | Quesenberry Tyler | $3,078,867 | |
| Previous Owner | Cain John William | $255,375 |
Source: Public Records
Tax History Compared to Growth
Tax History
| Year | Tax Paid | Tax Assessment Tax Assessment Total Assessment is a certain percentage of the fair market value that is determined by local assessors to be the total taxable value of land and additions on the property. | Land | Improvement |
|---|---|---|---|---|
| 2025 | $6,072 | $461,200 | $96,700 | $364,500 |
| 2024 | $5,948 | $464,500 | $96,700 | $367,800 |
| 2023 | $5,786 | $466,700 | $96,700 | $370,000 |
| 2022 | $5,270 | $425,600 | $106,900 | $318,700 |
| 2020 | $5,250 | $321,200 | $67,100 | $254,100 |
| 2019 | $4,576 | $328,900 | $56,400 | $272,500 |
| 2018 | $4,310 | $311,300 | $50,400 | $260,900 |
| 2017 | $4,062 | $283,500 | $47,400 | $236,100 |
| 2016 | $4,092 | $265,800 | $43,500 | $222,300 |
| 2015 | $3,934 | $250,400 | $41,700 | $208,700 |
| 2014 | $3,438 | $233,200 | $38,900 | $194,300 |
| 2013 | -- | $194,500 | $34,900 | $159,600 |
Source: Public Records
Map
Nearby Homes
- 19092 Johnson St NW
- 19071 Johnson St NW
- 19080 Edison St NW
- 19009 Ivanhoe Dr NW
- 18996 Ivanhoe St NW
- 18872 Fillmore St NW
- 18776 Ivanhoe St NW
- 18746 Ivanhoe St NW
- 18781 Grant St NW
- 18726 Ivanhoe St NW
- 18788 Grant St NW
- 18761 Grant St NW
- 18741 Grant St NW
- McKinley Plan at Bradford Park - Landmark Collection
- Cascade Plan at Bradford Park - Venture Collection
- Carlsbad Plan at Bradford Park - Venture Collection
- Marquette Plan at Bradford Park - Landmark Collection
- Sinclair Plan at Bradford Park - Landmark Collection
- Sequoia Plan at Bradford Park - Venture Collection
- Berkley Plan at Bradford Park - Venture Collection
- 10103 192 1/2 Ln NW
- 10113 192nd Ln NW
- 10125 192nd Ln NW
- 10040 Twin Lakes Rd NW
- 10112 192nd Ln NW
- 10112 192 1/2 Ln NW
- 10118 192nd Ln NW
- 10118 192 1/2 Ln NW
- 10135 192nd Ln NW
- 10135 10135 192nd-Lane-nw
- 10135 192 1/2 Ln NW
- 10122 192nd Ln NW
- 10122 192 1/2 Ln NW
- 19190 Hoover St NW
- 10128 192 1/2 Ln NW
- 19194 Hoover St NW
- 19196 Hoover St NW
- 10147 192nd Ln NW
- 10140 192nd Ln NW
- 10140 10140 192nd-Lane-nw