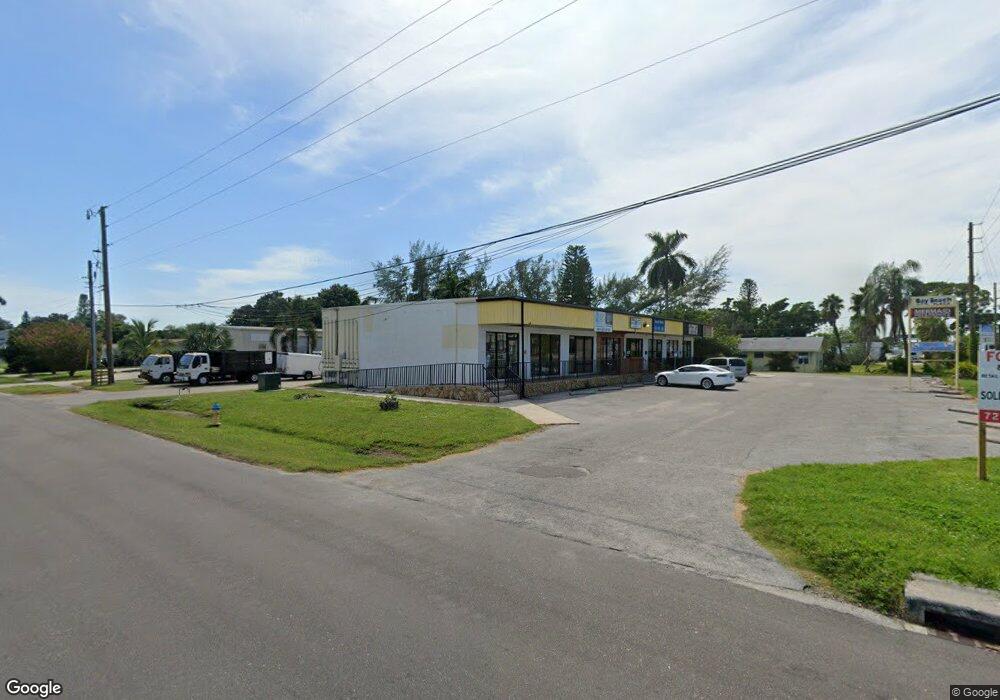
10103 Cortez Rd W Bradenton, FL 34210
Estimated Value: $1,133,422
--
Bed
--
Bath
5,390
Sq Ft
$210/Sq Ft
Est. Value
About This Home
This home is located at 10103 Cortez Rd W, Bradenton, FL 34210 and is currently estimated at $1,133,422, approximately $210 per square foot. 10103 Cortez Rd W is a home located in Manatee County with nearby schools including Sea Breeze Elementary School, W. D. Sugg Middle School, and Bayshore High School.
Ownership History
Date
Name
Owned For
Owner Type
Purchase Details
Closed on
Feb 16, 2021
Sold by
Christian St John Consulting Llc
Bought by
Sailing Crew Property Investment Llc
Current Estimated Value
Purchase Details
Closed on
Jun 25, 2018
Sold by
Boles Thomas
Bought by
Johmn Consuliti Ng Llc
Home Financials for this Owner
Home Financials are based on the most recent Mortgage that was taken out on this home.
Original Mortgage
$425,000
Interest Rate
4.5%
Mortgage Type
Unknown
Purchase Details
Closed on
May 1, 2017
Sold by
Steiner Charles M
Bought by
Boles Thomas
Home Financials for this Owner
Home Financials are based on the most recent Mortgage that was taken out on this home.
Original Mortgage
$300,000
Interest Rate
4.3%
Mortgage Type
Commercial
Purchase Details
Closed on
Sep 28, 2016
Sold by
Steiner Charles M and Steiner Sydell
Bought by
Steiner Charles M
Purchase Details
Closed on
Sep 1, 2016
Bought by
Boles Thomas
Purchase Details
Closed on
Aug 1, 2016
Bought by
Boles Thomas
Create a Home Valuation Report for This Property
The Home Valuation Report is an in-depth analysis detailing your home's value as well as a comparison with similar homes in the area
Home Values in the Area
Average Home Value in this Area
Purchase History
| Date | Buyer | Sale Price | Title Company |
|---|---|---|---|
| Sailing Crew Property Investment Llc | $810,000 | Barnes Walker Title Inc | |
| Johmn Consuliti Ng Llc | $485,000 | Barnes Walker Title Inc | |
| Boles Thomas | $390,000 | Attorney | |
| Steiner Charles M | -- | Attorney | |
| Boles Thomas | $100 | -- | |
| Boles Thomas | $100 | -- |
Source: Public Records
Mortgage History
| Date | Status | Borrower | Loan Amount |
|---|---|---|---|
| Previous Owner | Johmn Consuliti Ng Llc | $425,000 | |
| Previous Owner | Boles Thomas | $300,000 |
Source: Public Records
Tax History Compared to Growth
Tax History
| Year | Tax Paid | Tax Assessment Tax Assessment Total Assessment is a certain percentage of the fair market value that is determined by local assessors to be the total taxable value of land and additions on the property. | Land | Improvement |
|---|---|---|---|---|
| 2025 | $11,637 | $780,076 | $281,578 | $498,498 |
| 2024 | $11,637 | $742,967 | $267,134 | $475,833 |
| 2023 | $11,686 | $736,845 | $267,134 | $469,711 |
| 2022 | $11,315 | $707,862 | $242,688 | $465,174 |
| 2021 | $8,016 | $479,349 | $242,688 | $236,661 |
| 2020 | $8,182 | $475,607 | $204,181 | $271,426 |
| 2019 | $7,507 | $418,384 | $204,181 | $214,203 |
| 2018 | $6,024 | $317,149 | $220,188 | $96,961 |
| 2017 | $5,765 | $317,149 | $0 | $0 |
| 2016 | $5,611 | $302,556 | $0 | $0 |
| 2015 | $5,110 | $278,212 | $0 | $0 |
| 2014 | $5,110 | $265,000 | $0 | $0 |
| 2013 | $4,819 | $245,839 | $156,163 | $89,676 |
Source: Public Records
Map
Nearby Homes
- 4420 101st St W
- 4419 102nd St W
- 9810 Dorado Ave Unit 20E
- 9718 Hernando Ct
- 9822 Desoto Ct
- 9717 Santa Maria Ct
- 10216 46th Ave W
- 4603 103rd St W
- 9820 Royal Palm Dr
- 4216 Royal Palm Dr
- 4411 Mount Vernon Dr Unit 4411
- 4722 Independence Dr Unit 4722
- 9612 Valencia Cove
- 9619 Valencia Cove
- 4096 El Dorado Cove
- 4503 106th St W
- 4414 Mount Vernon Dr Unit 1
- 4428 106th St W
- 4108 La Costa Cove
- 4736 Independence Dr Unit 4736
- 10015 Cortez Rd W Unit 10015
- 10015 Cortez Rd W Unit D
- 10015 Cortez Rd W
- 10117 Cortez Rd W
- 4416 101st St W Unit A&B
- 4416 101st St W Unit B
- 4416 101st St W Unit A
- 4411 101st St W Unit A
- 4411 101st St W Unit A & B
- 10110 Cortez Rd W
- 0 Confidential Rd W Unit A4501402
- 0 Confidential Rd W Unit A4459656
- 10100 Cortez Rd W
- 4419 101st St W
- 4406 100th St W
- 4412 100th St W Unit B
- 4412 100th St W
- 4424 101st St W Unit N
- 4416 100th St W
- 4423 102nd St W