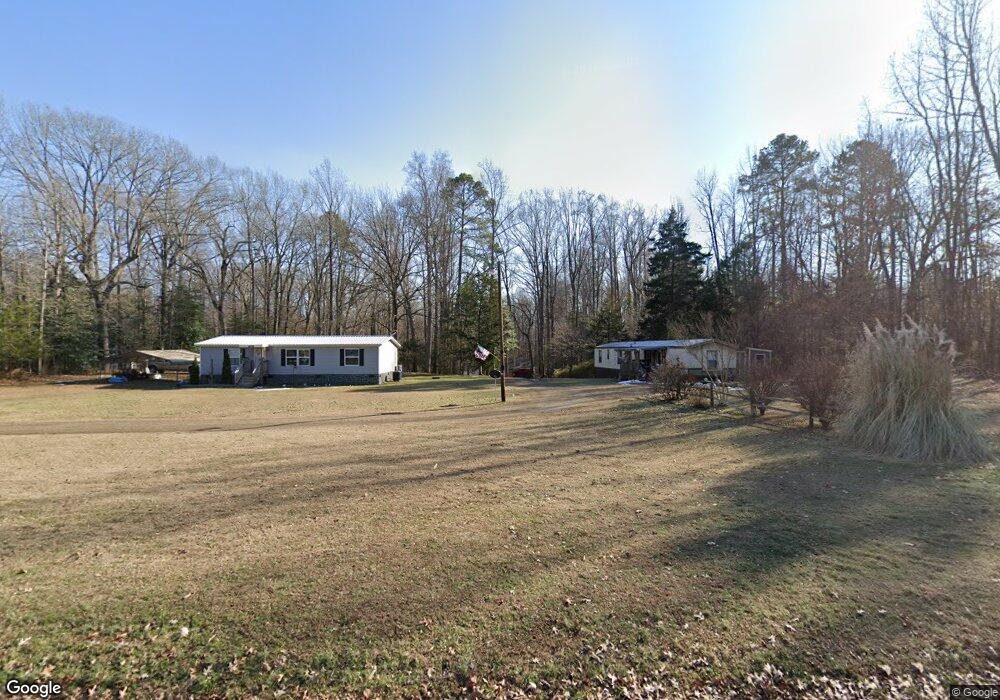
10107 Tunstall Rd Unit E New Kent, VA 23124
Estimated Value: $313,000 - $375,000
3
Beds
2
Baths
1,574
Sq Ft
$224/Sq Ft
Est. Value
About This Home
This home is located at 10107 Tunstall Rd Unit E, New Kent, VA 23124 and is currently estimated at $353,088, approximately $224 per square foot. 10107 Tunstall Rd Unit E is a home located in New Kent County with nearby schools including New Kent High School.
Ownership History
Date
Name
Owned For
Owner Type
Purchase Details
Closed on
Aug 1, 2015
Sold by
Schooff David W and Schooff Rose Marie
Bought by
Schooff Rose Marie
Current Estimated Value
Purchase Details
Closed on
Aug 10, 2011
Sold by
Vanhook Janet L
Bought by
Schooff David W
Home Financials for this Owner
Home Financials are based on the most recent Mortgage that was taken out on this home.
Original Mortgage
$50,000
Interest Rate
4.51%
Mortgage Type
Land Contract Argmt. Of Sale
Purchase Details
Closed on
Jan 22, 2008
Sold by
Neal Charles Joshua
Bought by
Vanhook Janet L
Create a Home Valuation Report for This Property
The Home Valuation Report is an in-depth analysis detailing your home's value as well as a comparison with similar homes in the area
Home Values in the Area
Average Home Value in this Area
Purchase History
| Date | Buyer | Sale Price | Title Company |
|---|---|---|---|
| Schooff Rose Marie | -- | None Available | |
| Schooff David W | $50,000 | -- | |
| Vanhook Janet L | $160,000 | -- |
Source: Public Records
Mortgage History
| Date | Status | Borrower | Loan Amount |
|---|---|---|---|
| Previous Owner | Vanhook Janet L | $50,000 |
Source: Public Records
Tax History Compared to Growth
Tax History
| Year | Tax Paid | Tax Assessment Tax Assessment Total Assessment is a certain percentage of the fair market value that is determined by local assessors to be the total taxable value of land and additions on the property. | Land | Improvement |
|---|---|---|---|---|
| 2025 | $1,755 | $292,500 | $91,600 | $200,900 |
| 2024 | $1,726 | $292,500 | $91,600 | $200,900 |
| 2023 | $1,665 | $248,500 | $64,900 | $183,600 |
| 2022 | $1,665 | $248,500 | $64,900 | $183,600 |
| 2021 | $1,738 | $220,000 | $52,900 | $167,100 |
| 2020 | $17 | $220,000 | $52,900 | $167,100 |
| 2019 | $1,742 | $212,400 | $43,600 | $168,800 |
| 2018 | $1,742 | $212,400 | $43,600 | $168,800 |
| 2017 | $1,679 | $202,300 | $43,600 | $158,700 |
| 2016 | $1,679 | $202,300 | $43,600 | $158,700 |
| 2015 | $1,511 | $179,900 | $38,300 | $141,600 |
| 2014 | -- | $179,900 | $38,300 | $141,600 |
Source: Public Records
Map
Nearby Homes
- 6085 Antler Hill Ct
- 5921 Bushnell Dr
- Drexel Plan at Greenwood Estates
- Drexel Plan at Falling Creek - The Estates at Falling Creek
- Brevard Plan at Falling Creek - The Estates at Falling Creek
- Asheboro Plan at Greenwood Estates
- Moseley Plan at Falling Creek - The Townes at Falling Creek
- Cypress Plan at Falling Creek - The Estates at Falling Creek
- Oxford Plan at Falling Creek - The Estates at Falling Creek
- Raleigh Plan at Falling Creek - The Estates at Falling Creek
- Avery Plan at Falling Creek - The Estates at Falling Creek
- Edgefield Plan at Greenwood Estates
- Ellerbe Plan at Falling Creek - The Estates at Falling Creek
- Davidson Plan at Falling Creek - The Estates at Falling Creek
- Marlston Plan at Falling Creek - The Townes at Falling Creek
- 6011 Hingham Dr
- 9013 Shewsbury Dr
- 8910 Tunstall Rd
- 7178 Canopy Cir
- 7200 Amarone Way
- 10031 Tunstall Rd Unit B
- 10042 Essex Hills Rd
- 10101 Tunstall Rd
- 10111 Tunstall Rd
- 10155 Tunstall Rd
- 10021 Tunstall Rd Unit C
- 10120 Tunstall Rd Unit E
- 10140 Tunstall Rd Unit G
- 10100 Tunstall Rd Unit D
- 10020 Tunstall Rd Unit B
- 10060 Tunstall Rd Unit C
- 10150 Tunstall Rd Unit F
- 10160 Tunstall Rd Unit H
- 10018 Tunstall Rd Unit A
- 10005 Tunstall Rd Unit G
- 10015 Tunstall Rd Unit F
- 10008 Essex Hills Rd
- 10001 Tunstall Rd
- 9860 Essex Hills Rd
- 10007 Essex Hills Rd