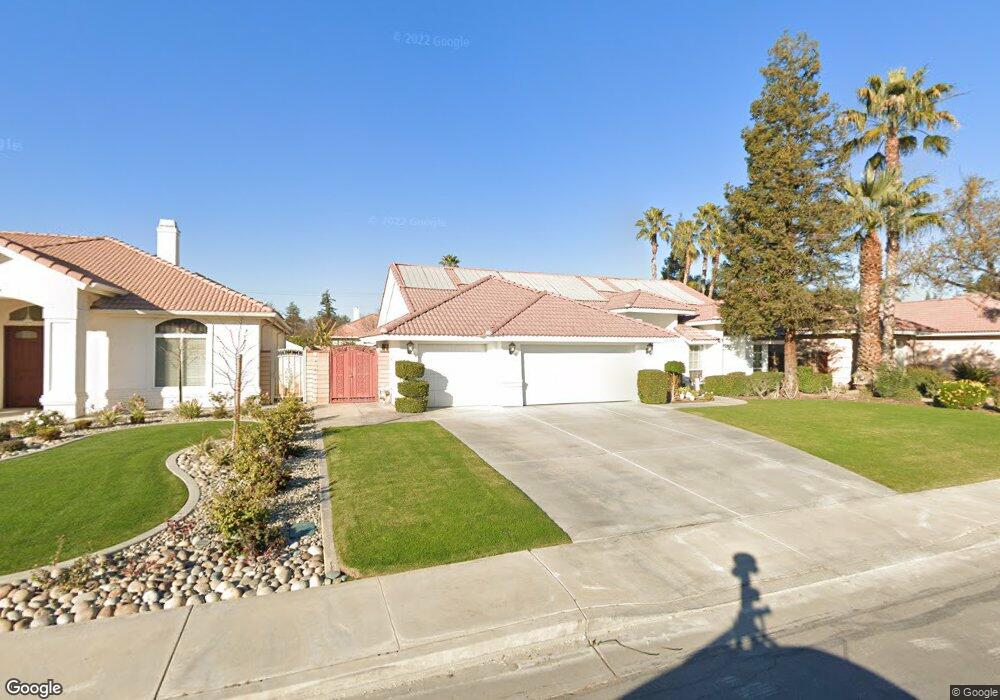
10108 Mountaingate Ln Bakersfield, CA 93311
Tevis Ranch NeighborhoodEstimated Value: $513,000 - $615,000
3
Beds
2
Baths
2,349
Sq Ft
$232/Sq Ft
Est. Value
About This Home
This home is located at 10108 Mountaingate Ln, Bakersfield, CA 93311 and is currently estimated at $544,435, approximately $231 per square foot. 10108 Mountaingate Ln is a home located in Kern County with nearby schools including Old River Elementary School, Earl Warren Junior High School, and Stockdale High School.
Ownership History
Date
Name
Owned For
Owner Type
Purchase Details
Closed on
May 4, 2012
Sold by
Yuniardt Sarah
Bought by
Tarmidi Tadeus
Current Estimated Value
Home Financials for this Owner
Home Financials are based on the most recent Mortgage that was taken out on this home.
Original Mortgage
$178,600
Outstanding Balance
$123,452
Interest Rate
3.85%
Mortgage Type
New Conventional
Estimated Equity
$420,983
Purchase Details
Closed on
Mar 20, 2000
Sold by
Tarmidi Sarah
Bought by
Tarmidi Tadeus
Purchase Details
Closed on
Dec 16, 1999
Sold by
Yuniardt Sarah
Bought by
Tarmidi Tadeus
Purchase Details
Closed on
Jul 28, 1999
Sold by
Michael & Robert Wattenbarger Inc
Bought by
Tarmidi Tadeus
Home Financials for this Owner
Home Financials are based on the most recent Mortgage that was taken out on this home.
Original Mortgage
$148,875
Interest Rate
7.68%
Create a Home Valuation Report for This Property
The Home Valuation Report is an in-depth analysis detailing your home's value as well as a comparison with similar homes in the area
Home Values in the Area
Average Home Value in this Area
Purchase History
| Date | Buyer | Sale Price | Title Company |
|---|---|---|---|
| Tarmidi Tadeus | -- | None Available | |
| Tarmidi Tadeus | -- | -- | |
| Tarmidi Tadeus | -- | Commonwealth Land Title Co | |
| Tarmidi Tadeus | $198,500 | Commonwealth Land Title Co |
Source: Public Records
Mortgage History
| Date | Status | Borrower | Loan Amount |
|---|---|---|---|
| Open | Tarmidi Tadeus | $178,600 | |
| Previous Owner | Tarmidi Tadeus | $148,875 | |
| Closed | Tarmidi Tadeus | $29,775 |
Source: Public Records
Tax History
| Year | Tax Paid | Tax Assessment Tax Assessment Total Assessment is a certain percentage of the fair market value that is determined by local assessors to be the total taxable value of land and additions on the property. | Land | Improvement |
|---|---|---|---|---|
| 2025 | $4,473 | $317,653 | $69,151 | $248,502 |
| 2024 | $4,410 | $311,427 | $67,796 | $243,631 |
| 2023 | $4,410 | $305,321 | $66,467 | $238,854 |
| 2022 | $4,239 | $299,335 | $65,164 | $234,171 |
| 2021 | $4,110 | $293,468 | $63,887 | $229,581 |
| 2020 | $4,110 | $290,460 | $63,232 | $227,228 |
| 2019 | $3,912 | $290,460 | $63,232 | $227,228 |
| 2018 | $3,731 | $279,185 | $60,778 | $218,407 |
| 2017 | $3,761 | $273,712 | $59,587 | $214,125 |
| 2016 | $3,514 | $268,347 | $58,419 | $209,928 |
| 2015 | $3,486 | $264,318 | $57,542 | $206,776 |
| 2014 | $3,328 | $259,141 | $56,415 | $202,726 |
Source: Public Records
Map
Nearby Homes
- 10204 Sunset Canyon Dr
- 10103 Wentworth Ct
- 3508 Running Springs Way
- 3513 Running Springs Way
- 12635 Camino Glorieta
- 10213 Single Oak Dr
- 10011 Rosebud Ave
- 10600 Petalo Dr
- 10400 Redbridge Way
- 9902 Rancho Verde Dr
- 10616 Petalo Dr
- 9815 Cabbage Rose Ave
- 10703 Petalo Dr
- 9814 Cabbage Rose Ave
- 9800 Cabbage Rose Ave
- 9711 Touchstone Dr
- 3809 Wensley Ct
- 9703 Touchstone Dr
- 3105 Whisper Oak Way
- 10808 Tivoli Ct
- 10104 Mountaingate Ln
- 10112 Mountaingate Ln
- 10111 Wentworth Ct
- 10100 Mountaingate Ln
- 10116 Mountaingate Ln
- 10115 Wentworth Ct
- 10107 Wentworth Ct
- 10109 Mountaingate Ln
- 10119 Wentworth Ct
- 10105 Mountaingate Ln
- 10115 Mountaingate Ln
- 10014 Mountaingate Ln
- 10101 Mountaingate Ln
- 10117 Mountaingate Ln
- 10015 Wentworth Ct
- 10202 Mountaingate Ln
- 10015 Mountaingate Ln
- 10010 Mountaingate Ln
- 10121 Mountaingate Ln
- 10201 Wentworth Ct
Your Personal Tour Guide
Ask me questions while you tour the home.