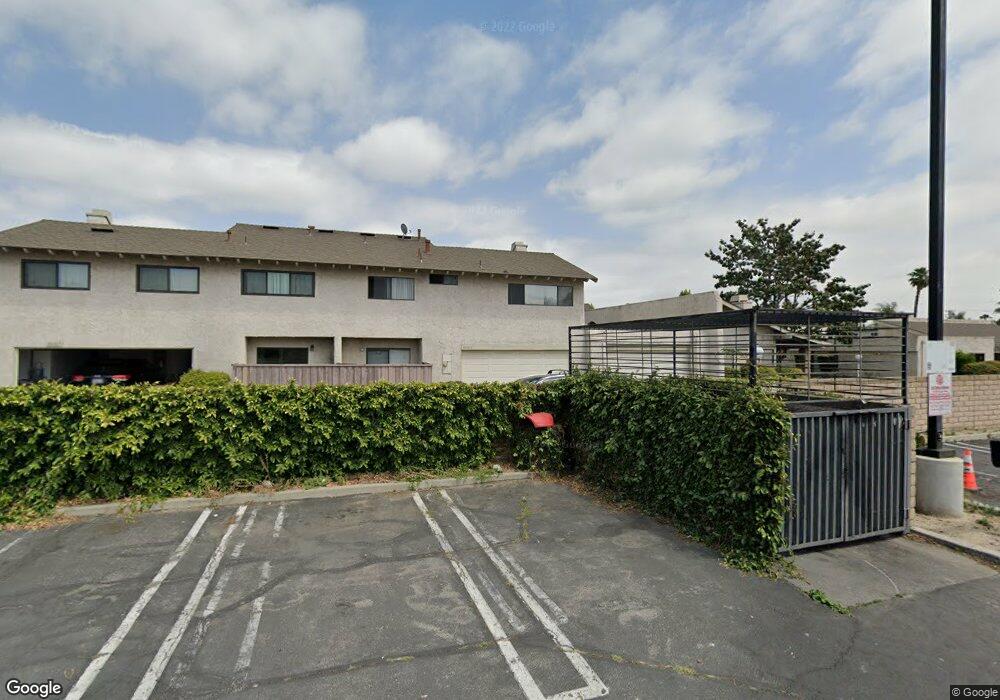
10109 Hidden Village Rd Garden Grove, CA 92840
Estimated Value: $834,000 - $939,000
3
Beds
3
Baths
1,630
Sq Ft
$535/Sq Ft
Est. Value
About This Home
This home is located at 10109 Hidden Village Rd, Garden Grove, CA 92840 and is currently estimated at $871,384, approximately $534 per square foot. 10109 Hidden Village Rd is a home located in Orange County with nearby schools including Brookhurst Elementary School, Garden Grove High School, and St. Columban School.
Ownership History
Date
Name
Owned For
Owner Type
Purchase Details
Closed on
Apr 21, 2003
Sold by
Trinh Lan Nhu
Bought by
Trinh Lan Nhu
Current Estimated Value
Home Financials for this Owner
Home Financials are based on the most recent Mortgage that was taken out on this home.
Original Mortgage
$210,000
Interest Rate
5.72%
Purchase Details
Closed on
Jan 12, 1998
Sold by
Do Thanh Viet
Bought by
Trinh Lan Nhu
Home Financials for this Owner
Home Financials are based on the most recent Mortgage that was taken out on this home.
Original Mortgage
$118,700
Interest Rate
6.95%
Purchase Details
Closed on
Feb 12, 1993
Sold by
Trinh Lan Nhu and Trinh Lan T
Bought by
Trinh Lan Nhu
Home Financials for this Owner
Home Financials are based on the most recent Mortgage that was taken out on this home.
Original Mortgage
$120,300
Interest Rate
7.74%
Create a Home Valuation Report for This Property
The Home Valuation Report is an in-depth analysis detailing your home's value as well as a comparison with similar homes in the area
Home Values in the Area
Average Home Value in this Area
Purchase History
| Date | Buyer | Sale Price | Title Company |
|---|---|---|---|
| Trinh Lan Nhu | -- | Southland Title | |
| Trinh Lan Nhu | -- | California Counties Title Co | |
| Trinh Lan Nhu | -- | Investors Title Company |
Source: Public Records
Mortgage History
| Date | Status | Borrower | Loan Amount |
|---|---|---|---|
| Closed | Trinh Lan Nhu | $210,000 | |
| Closed | Trinh Lan Nhu | $118,700 | |
| Closed | Trinh Lan Nhu | $120,300 |
Source: Public Records
Tax History Compared to Growth
Tax History
| Year | Tax Paid | Tax Assessment Tax Assessment Total Assessment is a certain percentage of the fair market value that is determined by local assessors to be the total taxable value of land and additions on the property. | Land | Improvement |
|---|---|---|---|---|
| 2025 | $2,832 | $215,928 | $72,324 | $143,604 |
| 2024 | $2,832 | $211,695 | $70,906 | $140,789 |
| 2023 | $2,775 | $207,545 | $69,516 | $138,029 |
| 2022 | $2,713 | $203,476 | $68,153 | $135,323 |
| 2021 | $2,682 | $199,487 | $66,817 | $132,670 |
| 2020 | $2,647 | $197,442 | $66,132 | $131,310 |
| 2019 | $2,598 | $193,571 | $64,835 | $128,736 |
| 2018 | $2,630 | $189,776 | $63,564 | $126,212 |
| 2017 | $2,594 | $186,055 | $62,317 | $123,738 |
| 2016 | $2,474 | $182,407 | $61,095 | $121,312 |
| 2015 | $2,439 | $179,668 | $60,178 | $119,490 |
| 2014 | $2,381 | $176,149 | $58,999 | $117,150 |
Source: Public Records
Map
Nearby Homes
- 10181 Lampson Ave
- 12266 Madras Place
- 12262 Morrie Ln
- 12424 Lambert Cir
- 10402 Law Dr
- 12342 Rea Cir
- 10442 Lampson Ave
- 12551 Nutwood St
- 11912 Brookhaven St Unit 65
- 10520 Lakeside Dr N Unit L
- 10560 Lakeside Dr N Unit B
- 10541 Lakeside Dr S Unit P
- 10580 Lakeside Dr N Unit E
- 10371 Garden Grove Blvd Unit 16
- 10371 Garden Grove Blvd Unit 20
- 9841 Cockatoo Ln
- 10072 Roselee Dr
- 10401 W Garden Grove Blvd Unit 53
- 10221 Roselee Dr
- 10094 Larson Ave
- 10107 Hidden Village Rd
- 10111 Hidden Village Rd
- 10105 Hidden Village Rd
- 10079 Hidden Village Rd
- 10049 Hidden Village Rd
- 10047 Hidden Village Rd
- 10039 Hidden Village Rd
- 10041 Hidden Village Rd
- 10045 Hidden Village Rd
- 10077 Hidden Village Rd
- 10103 Hidden Village Rd
- 10043 Hidden Village Rd
- 10081 Hidden Village Rd
- 12392 Brookhurst St
- 10051 Hidden Village Rd
- 10075 Hidden Village Rd
- 10053 Hidden Village Rd
- 10083 Hidden Village Rd
- 10073 Hidden Village Rd
- 10057 Hidden Village Rd