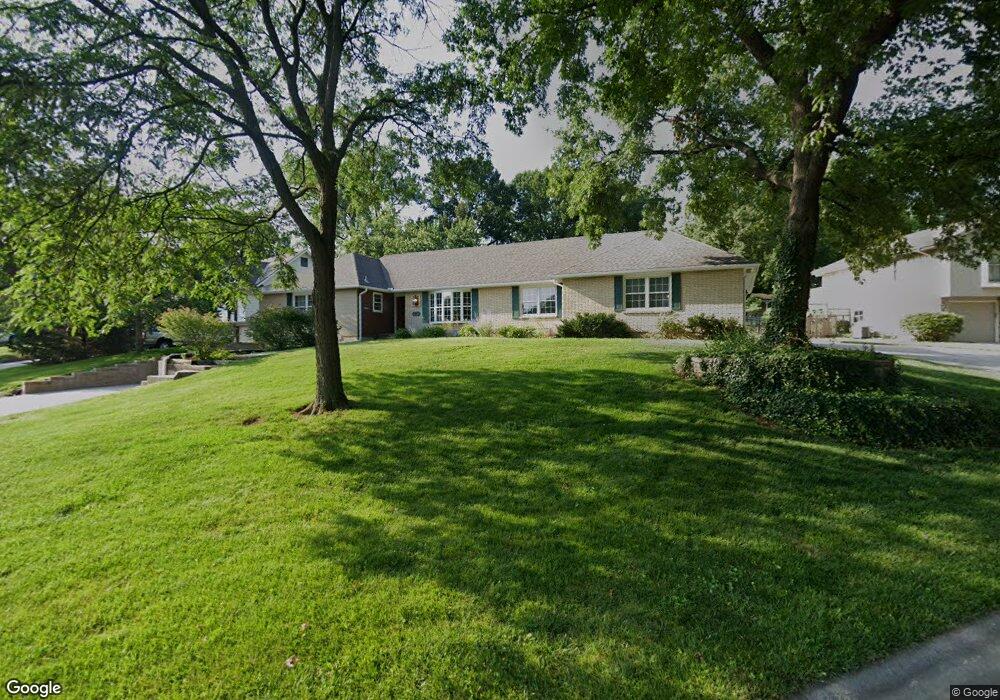
10109 W 65th Dr Shawnee, KS 66203
Estimated Value: $391,580 - $456,000
3
Beds
2
Baths
1,920
Sq Ft
$219/Sq Ft
Est. Value
About This Home
This home is located at 10109 W 65th Dr, Shawnee, KS 66203 and is currently estimated at $419,895, approximately $218 per square foot. 10109 W 65th Dr is a home located in Johnson County with nearby schools including Nieman Elementary School, Hocker Grove Middle School, and Shawnee Mission North High School.
Ownership History
Date
Name
Owned For
Owner Type
Purchase Details
Closed on
May 10, 2010
Sold by
Capitol Federal Savings Bank
Bought by
Schieber Benedict J
Current Estimated Value
Home Financials for this Owner
Home Financials are based on the most recent Mortgage that was taken out on this home.
Original Mortgage
$159,225
Interest Rate
5.25%
Mortgage Type
FHA
Purchase Details
Closed on
Feb 16, 2010
Sold by
Schussele Jeffrey A and Schussele Sara E
Bought by
Capitol Federal Savings Bank and Capitol Federal Savings & Loan Associati
Purchase Details
Closed on
Jun 27, 2003
Sold by
Derr Linda C and Mcfarland Richard B
Bought by
Schussele Jeffrey A and Schussele Sara E
Home Financials for this Owner
Home Financials are based on the most recent Mortgage that was taken out on this home.
Original Mortgage
$195,795
Interest Rate
4%
Mortgage Type
Purchase Money Mortgage
Create a Home Valuation Report for This Property
The Home Valuation Report is an in-depth analysis detailing your home's value as well as a comparison with similar homes in the area
Home Values in the Area
Average Home Value in this Area
Purchase History
| Date | Buyer | Sale Price | Title Company |
|---|---|---|---|
| Schieber Benedict J | -- | First American Title Ins Co | |
| Capitol Federal Savings Bank | $188,736 | Continental Title Company | |
| Schussele Jeffrey A | -- | Security Land Title Company |
Source: Public Records
Mortgage History
| Date | Status | Borrower | Loan Amount |
|---|---|---|---|
| Previous Owner | Schieber Benedict J | $159,225 | |
| Previous Owner | Schussele Jeffrey A | $195,795 |
Source: Public Records
Tax History Compared to Growth
Tax History
| Year | Tax Paid | Tax Assessment Tax Assessment Total Assessment is a certain percentage of the fair market value that is determined by local assessors to be the total taxable value of land and additions on the property. | Land | Improvement |
|---|---|---|---|---|
| 2024 | $4,834 | $44,252 | $6,994 | $37,258 |
| 2023 | $4,727 | $44,171 | $6,994 | $37,177 |
| 2022 | $4,651 | $41,838 | $6,360 | $35,478 |
| 2021 | $4,201 | $36,236 | $5,522 | $30,714 |
| 2020 | $3,945 | $33,775 | $5,522 | $28,253 |
| 2019 | $3,914 | $33,488 | $4,806 | $28,682 |
| 2018 | $3,341 | $31,855 | $4,377 | $27,478 |
| 2017 | $3,318 | $27,761 | $4,377 | $23,384 |
| 2016 | $3,198 | $26,577 | $4,377 | $22,200 |
| 2015 | $2,943 | $24,645 | $4,377 | $20,268 |
| 2013 | -- | $23,104 | $4,377 | $18,727 |
Source: Public Records
Map
Nearby Homes
- 10924 W 67th St
- 6420 Ballentine St
- 10235 W 70th St
- 10024 W 70th Terrace
- 9906 Edelweiss Cir
- 10406 W 71st Place
- 10152 Edelweiss Cir
- 10236 Edelweiss Cir
- 6901 Grandview St
- 10914 W 71st St
- 5933 Knox Ave
- 11217 W 69th Terrace
- 10103 Johnson Dr
- 10902 W 71st Place
- 10314 W 73rd St
- 7240 Mastin St
- 7226 Edgewood Blvd
- 6724 Mackey St
- 11406 W 71st St
- 11637 W 68th Terrace
- 9929 W 65th Place
- 10115 W 65th Dr
- 9928 W 65th Place
- 9925 W 65th Place
- 10020 W 66th Terrace
- 10110 W 65th Dr
- 10114 W 65th Dr
- 10010 W 66th Terrace
- 9924 W 65th Place
- 10106 W 65th Dr
- 10117 W 65th Dr
- 9921 W 65th Place
- 6610 Wedd Place
- 9970 W 66th Terrace
- 9925 W 65th Dr
- 10116 W 66th Terrace
- 10118 W 65th Dr
- 10101 W 65th St
- 9960 W 66th Terrace
- 9920 W 65th Place