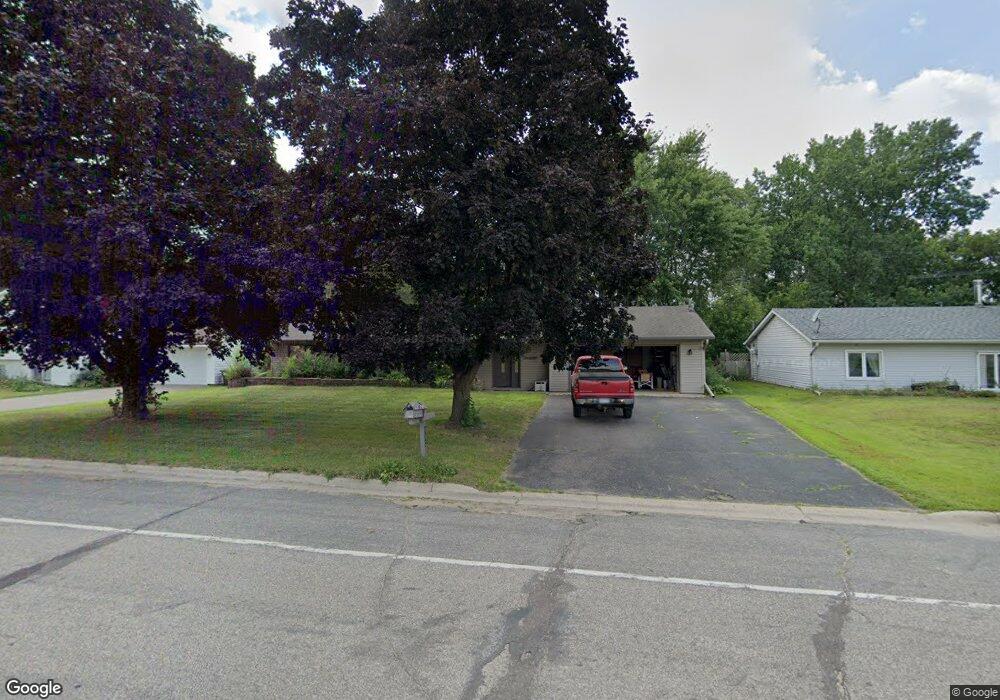
1011 1011 3rd St St. Paul Park, MN 55071
Estimated Value: $283,047 - $336,000
3
Beds
1
Bath
1,440
Sq Ft
$210/Sq Ft
Est. Value
About This Home
This home is located at 1011 1011 3rd St, St. Paul Park, MN 55071 and is currently estimated at $302,512, approximately $210 per square foot. 1011 1011 3rd St is a home located in Washington County with nearby schools including Pullman Elementary School, Oltman Middle School, and Park Senior High School.
Ownership History
Date
Name
Owned For
Owner Type
Purchase Details
Closed on
Oct 14, 2015
Sold by
Anderson Brendan and Anderson Amanda
Bought by
Wright John W
Current Estimated Value
Home Financials for this Owner
Home Financials are based on the most recent Mortgage that was taken out on this home.
Original Mortgage
$174,775
Interest Rate
3.75%
Mortgage Type
FHA
Create a Home Valuation Report for This Property
The Home Valuation Report is an in-depth analysis detailing your home's value as well as a comparison with similar homes in the area
Home Values in the Area
Average Home Value in this Area
Purchase History
| Date | Buyer | Sale Price | Title Company |
|---|---|---|---|
| Wright John W | $178,000 | Dca Title |
Source: Public Records
Mortgage History
| Date | Status | Borrower | Loan Amount |
|---|---|---|---|
| Previous Owner | Wright John W | $174,775 |
Source: Public Records
Tax History Compared to Growth
Tax History
| Year | Tax Paid | Tax Assessment Tax Assessment Total Assessment is a certain percentage of the fair market value that is determined by local assessors to be the total taxable value of land and additions on the property. | Land | Improvement |
|---|---|---|---|---|
| 2024 | $3,154 | $253,600 | $72,000 | $181,600 |
| 2023 | $3,154 | $243,300 | $72,000 | $171,300 |
| 2022 | $2,558 | $232,200 | $71,500 | $160,700 |
| 2021 | $2,416 | $194,900 | $59,500 | $135,400 |
| 2020 | $2,606 | $188,100 | $59,500 | $128,600 |
| 2019 | $2,502 | $198,600 | $67,000 | $131,600 |
| 2018 | $2,340 | $181,400 | $59,000 | $122,400 |
| 2017 | $2,046 | $170,700 | $55,000 | $115,700 |
| 2016 | $1,992 | $155,500 | $52,000 | $103,500 |
| 2015 | $1,894 | $130,700 | $46,600 | $84,100 |
| 2013 | -- | $105,100 | $36,500 | $68,600 |
Source: Public Records
Map
Nearby Homes
- 11XX 1st St
- 1121 5th St
- 1142 1st St
- 1227 5th St
- 1033 Portland Ave
- 801 Summit Ave
- 1200 Summit Ave
- 1410 5th St
- TBD Broadway Ave
- 1020 Gary Dr
- 1571 Summit Ave
- 1601 14th Ave
- 1712 Selby Ave
- 6444 Genevieve Trail
- 4049 75th St E
- 7344 Degrio Way
- 7023 Concord Blvd
- 7394 Dawn Ave
- 10406 Glenbrook Ave S
- 10442 Glenbrook Ave S