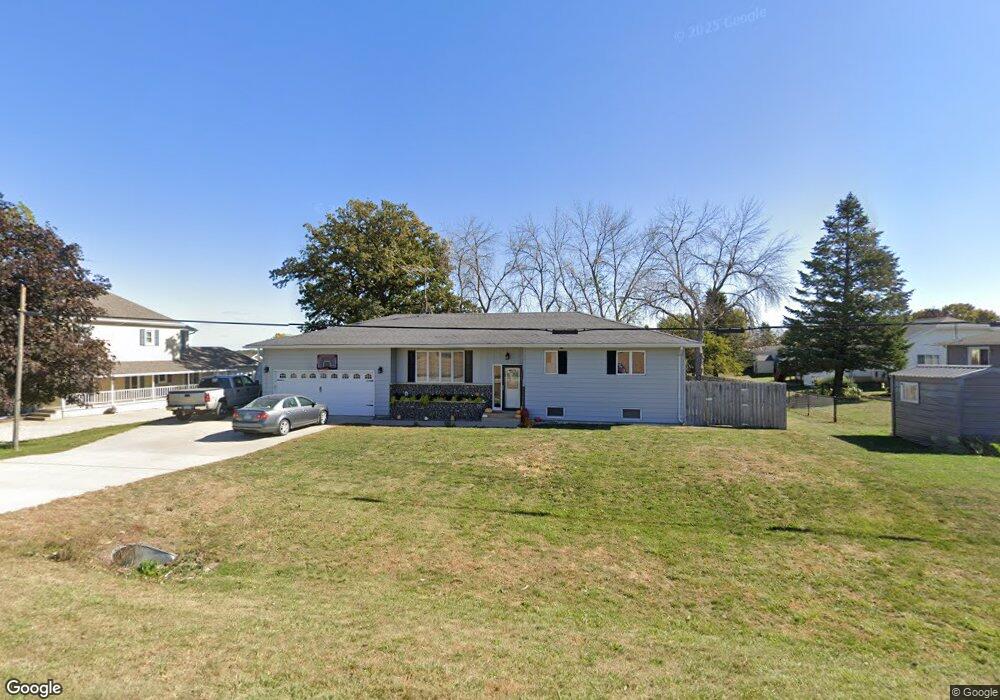
1011 3rd St W Cresco, IA 52136
Estimated Value: $198,799 - $218,000
3
Beds
2
Baths
1,310
Sq Ft
$161/Sq Ft
Est. Value
About This Home
This home is located at 1011 3rd St W, Cresco, IA 52136 and is currently estimated at $210,950, approximately $161 per square foot. 1011 3rd St W is a home located in Howard County with nearby schools including Crestwood High School and Notre Dame Catholic School.
Ownership History
Date
Name
Owned For
Owner Type
Purchase Details
Closed on
Apr 1, 2021
Sold by
Gomez Cibrian Eduardo
Bought by
Nolan Josey M and Fairchild Tylor
Current Estimated Value
Home Financials for this Owner
Home Financials are based on the most recent Mortgage that was taken out on this home.
Original Mortgage
$150,590
Outstanding Balance
$135,221
Interest Rate
2.8%
Mortgage Type
FHA
Estimated Equity
$75,729
Purchase Details
Closed on
Feb 5, 2018
Sold by
Manske Ryan P and Manke Holly M
Bought by
Gomez-Cibrian Eduardo
Purchase Details
Closed on
Nov 22, 2011
Sold by
Manske Ryan P and Manske Holly M
Bought by
Manske Ryan P and Manske Holly M
Create a Home Valuation Report for This Property
The Home Valuation Report is an in-depth analysis detailing your home's value as well as a comparison with similar homes in the area
Home Values in the Area
Average Home Value in this Area
Purchase History
| Date | Buyer | Sale Price | Title Company |
|---|---|---|---|
| Nolan Josey M | $156,000 | None Listed On Document | |
| Gomez-Cibrian Eduardo | $148,000 | -- | |
| Manske Ryan P | -- | None Available |
Source: Public Records
Mortgage History
| Date | Status | Borrower | Loan Amount |
|---|---|---|---|
| Open | Nolan Josey M | $150,590 |
Source: Public Records
Tax History
| Year | Tax Paid | Tax Assessment Tax Assessment Total Assessment is a certain percentage of the fair market value that is determined by local assessors to be the total taxable value of land and additions on the property. | Land | Improvement |
|---|---|---|---|---|
| 2025 | $2,716 | $163,600 | $19,320 | $144,280 |
| 2024 | $2,716 | $147,420 | $19,320 | $128,100 |
| 2023 | $424 | $147,420 | $19,320 | $128,100 |
| 2022 | $2,900 | $123,920 | $19,320 | $104,600 |
| 2021 | $2,890 | $123,920 | $19,320 | $104,600 |
| 2020 | $2,424 | $116,740 | $19,320 | $97,420 |
| 2019 | $2,780 | $109,710 | $0 | $0 |
| 2018 | $424 | $109,710 | $0 | $0 |
| 2017 | $2,686 | $110,880 | $0 | $0 |
| 2016 | $2,883 | $110,880 | $0 | $0 |
| 2015 | $2,266 | $110,880 | $0 | $0 |
| 2014 | $2,314 | $110,880 | $0 | $0 |
Source: Public Records
Map
Nearby Homes
- 211 Royal Oaks Dr
- 723 2nd St W
- 619 3rd St W
- 732 N Elm St
- 205 6th Ave W
- 106 6th Ave W
- 306 5th Ave W
- 226 4th Ave W
- 120 5th Ave E
- 113 5th Ave E
- 1112 9th St E
- 303 3rd St SW Unit Farley
- 729 2nd St SW
- 0 Co Rd A23 Unit NOC6333468
- 16267 Yankee Ave
- Rd
- 13020 241st Ave
- TBD ( Lot 6, Blk 2) 3rd Ave SE
- TBD (Lot 4 Blk2 ) 3rd Ave SE
- TBD ( Lot 2, Blk 2) 3rd Ave SE
- 1011 3rd St W
- 292 Red Maple Ave
- 288 Red Maple Ave
- 1019 3rd St W
- 238 Royal Oaks Dr
- 284 Red Maple Ave
- 230 Royal Oaks Dr
- 229 Royal Oaks Dr
- 291 Red Maple Ave
- 1035 3rd St W
- 287 Red Maple Ave
- 224 Royal Oaks Dr
- 281 Red Maple Ave
- 280 Red Maple Ave
- 917 3rd St W
- 218 Royal Oaks Dr
- 1014 Prospect St
- 231 Royal Oaks Dr
- 1012 Prospect St
- 227 Royal Oaks Dr
Your Personal Tour Guide
Ask me questions while you tour the home.