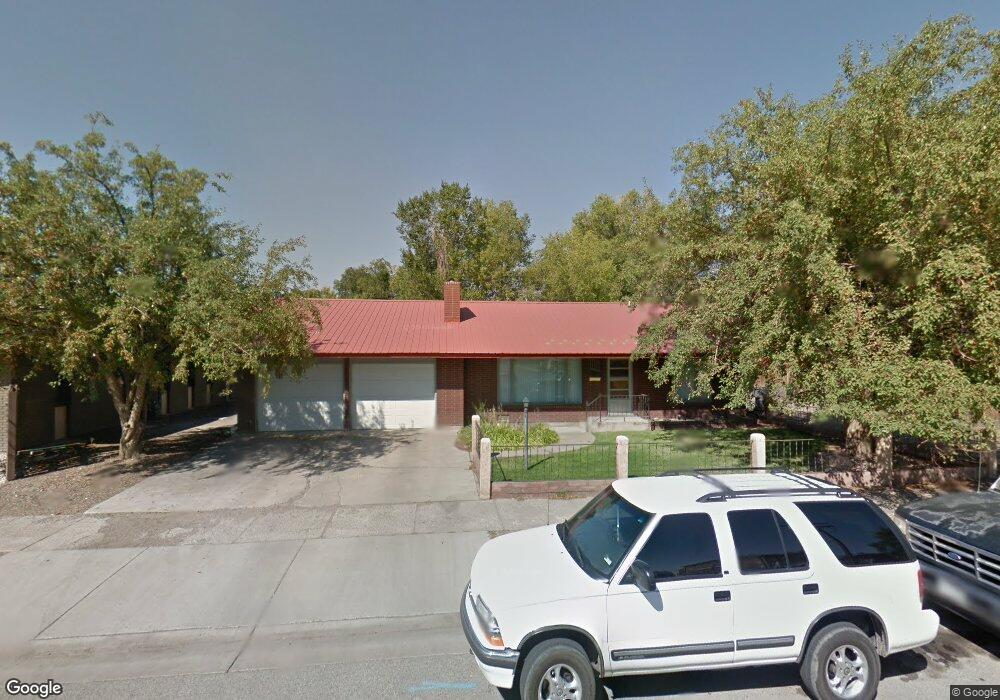
1011 4th St Alamosa, CO 81101
Estimated Value: $280,000 - $314,000
3
Beds
2
Baths
1,800
Sq Ft
$161/Sq Ft
Est. Value
About This Home
This home is located at 1011 4th St, Alamosa, CO 81101 and is currently estimated at $290,130, approximately $161 per square foot. 1011 4th St is a home located in Alamosa County with nearby schools including Alamosa Elementary School, Ortega Middle School, and Alamosa High School.
Ownership History
Date
Name
Owned For
Owner Type
Purchase Details
Closed on
Jun 2, 2021
Sold by
Rodgers Kevin S
Bought by
Lujan Antonio L and Trunnell Claudia N
Current Estimated Value
Home Financials for this Owner
Home Financials are based on the most recent Mortgage that was taken out on this home.
Original Mortgage
$152,000
Outstanding Balance
$137,617
Interest Rate
2.9%
Mortgage Type
New Conventional
Estimated Equity
$152,513
Purchase Details
Closed on
May 4, 2010
Sold by
Barrier Marilyn Mclntyre
Bought by
Rodgers Kevin S
Home Financials for this Owner
Home Financials are based on the most recent Mortgage that was taken out on this home.
Original Mortgage
$131,122
Interest Rate
4.93%
Mortgage Type
New Conventional
Purchase Details
Closed on
Feb 7, 2006
Sold by
Mcintyre Barrier Marilyn
Bought by
Mcintyre Barrier Marilyn
Purchase Details
Closed on
Nov 3, 1993
Sold by
Mcintyre Harold J and Mcintyre Peggy Lou
Bought by
Mcintyre Peggy Lou
Purchase Details
Closed on
Sep 6, 1966
Bought by
Mcintyre Harold J
Create a Home Valuation Report for This Property
The Home Valuation Report is an in-depth analysis detailing your home's value as well as a comparison with similar homes in the area
Home Values in the Area
Average Home Value in this Area
Purchase History
| Date | Buyer | Sale Price | Title Company |
|---|---|---|---|
| Lujan Antonio L | $190,000 | None Available | |
| Rodgers Kevin S | $125,000 | Southwest Title Co | |
| Mcintyre Barrier Marilyn | -- | None Available | |
| Mcintyre Peggy Lou | -- | -- | |
| Mcintyre Harold J | $11,000 | -- |
Source: Public Records
Mortgage History
| Date | Status | Borrower | Loan Amount |
|---|---|---|---|
| Open | Lujan Antonio L | $152,000 | |
| Previous Owner | Rodgers Kevin S | $131,122 |
Source: Public Records
Tax History Compared to Growth
Tax History
| Year | Tax Paid | Tax Assessment Tax Assessment Total Assessment is a certain percentage of the fair market value that is determined by local assessors to be the total taxable value of land and additions on the property. | Land | Improvement |
|---|---|---|---|---|
| 2024 | $1,046 | $17,833 | $1,444 | $16,389 |
| 2023 | $1,072 | $18,006 | $1,458 | $16,548 |
| 2022 | $1,102 | $14,323 | $1,027 | $13,296 |
| 2021 | $1,133 | $14,323 | $1,027 | $13,296 |
| 2020 | $1,027 | $14,323 | $1,027 | $13,296 |
| 2019 | $1,030 | $12,758 | $1,027 | $11,731 |
| 2018 | $959 | $11,667 | $1,035 | $10,632 |
| 2017 | $960 | $11,667 | $1,035 | $10,632 |
| 2016 | $1,008 | $12,305 | $1,144 | $11,161 |
| 2015 | $1,007 | $12,305 | $1,144 | $11,161 |
| 2014 | -- | $12,305 | $1,144 | $11,161 |
| 2013 | -- | $12,305 | $1,144 | $11,161 |
Source: Public Records
Map
Nearby Homes
- 302 Bell Ave
- 212 Bell Ave
- 0 U S 160
- 24 Alamosa Ave
- 531 Alamosa Ave
- 0 Mountain View Blvd Unit 23881373
- Lot 14 Fourth St
- 735 First St
- 720 1st St
- 6 Mountain View Place
- 117 La Veta Ave
- 1623-B 6th St
- 400 & 406 6th St
- 631 2nd St
- 6 Bellwood Dr
- 119 Poncha Ave
- 1330 W 7th St
- 125 Lots Cottonwoods Phase II
- 82 Monterey Ave
- 1002 Edison Ave