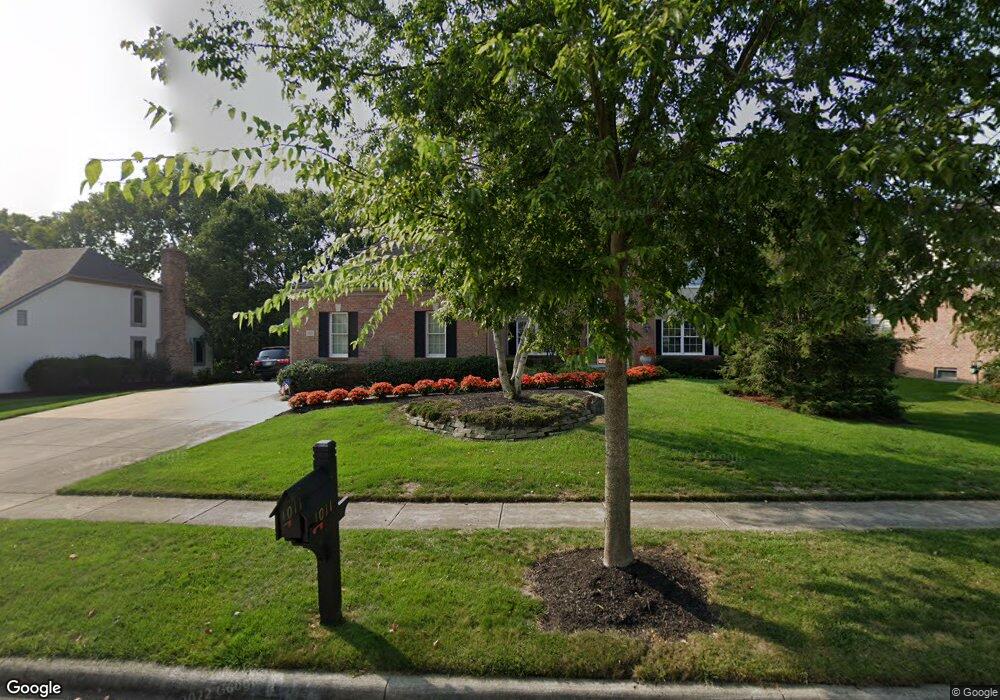
1011 Bluffpoint Dr Unit 171 Columbus, OH 43235
Worthingview NeighborhoodEstimated Value: $622,000 - $769,000
4
Beds
4
Baths
2,910
Sq Ft
$236/Sq Ft
Est. Value
About This Home
This home is located at 1011 Bluffpoint Dr Unit 171, Columbus, OH 43235 and is currently estimated at $685,455, approximately $235 per square foot. 1011 Bluffpoint Dr Unit 171 is a home located in Franklin County with nearby schools including Bluffsview Elementary School, McCord Middle School, and Worthington Kilbourne High School.
Ownership History
Date
Name
Owned For
Owner Type
Purchase Details
Closed on
Oct 31, 2019
Sold by
Caswell Kenneth M and Caswell Lynn
Bought by
Caswell Kenneth M and Caswell Lynn
Current Estimated Value
Purchase Details
Closed on
Aug 31, 1999
Sold by
Cooper Robert W
Bought by
Caswell Kenneth M and Caswell Lynn
Home Financials for this Owner
Home Financials are based on the most recent Mortgage that was taken out on this home.
Original Mortgage
$68,800
Interest Rate
7.59%
Purchase Details
Closed on
Dec 9, 1992
Bought by
Cooper Robert W
Purchase Details
Closed on
Dec 13, 1990
Create a Home Valuation Report for This Property
The Home Valuation Report is an in-depth analysis detailing your home's value as well as a comparison with similar homes in the area
Home Values in the Area
Average Home Value in this Area
Purchase History
| Date | Buyer | Sale Price | Title Company |
|---|---|---|---|
| Caswell Kenneth M | -- | None Available | |
| Caswell Kenneth M | $86,000 | Chicago Title West | |
| Cooper Robert W | $315,000 | -- | |
| -- | $70,000 | -- |
Source: Public Records
Mortgage History
| Date | Status | Borrower | Loan Amount |
|---|---|---|---|
| Closed | Caswell Kenneth M | $68,800 |
Source: Public Records
Tax History Compared to Growth
Tax History
| Year | Tax Paid | Tax Assessment Tax Assessment Total Assessment is a certain percentage of the fair market value that is determined by local assessors to be the total taxable value of land and additions on the property. | Land | Improvement |
|---|---|---|---|---|
| 2024 | $12,380 | $201,640 | $56,000 | $145,640 |
| 2023 | $11,838 | $201,635 | $56,000 | $145,635 |
| 2022 | $13,583 | $183,580 | $36,230 | $147,350 |
| 2021 | $12,531 | $183,580 | $36,230 | $147,350 |
| 2020 | $12,070 | $183,580 | $36,230 | $147,350 |
| 2019 | $11,550 | $158,520 | $31,500 | $127,020 |
| 2018 | $10,251 | $158,520 | $31,500 | $127,020 |
| 2017 | $9,831 | $158,520 | $31,500 | $127,020 |
| 2016 | $9,311 | $131,150 | $34,160 | $96,990 |
| 2015 | $9,313 | $131,150 | $34,160 | $96,990 |
| 2014 | $9,310 | $131,150 | $34,160 | $96,990 |
| 2013 | $4,359 | $123,410 | $31,045 | $92,365 |
Source: Public Records
Map
Nearby Homes
- 1101 Bluffway Dr
- 7522 Acela St
- 1041 Rosebank Dr
- 1380 Tiehack Ct
- 7164 Durness Place
- 1620 Park Row Dr Unit A
- 472 Blandings Ct
- 1637 Park Row Dr Unit F
- 784 Pinecliff Place
- 2687 Snouffer Rd
- 1118 Ravine Ridge Dr
- 865 Colony Way
- 941 Clubview Blvd S
- 110 Whieldon Ln
- 1307 Lakeside Ct
- 6550 Winston Ct E
- 210 Saint Antoine St Unit 25D
- 1828 Gardenstone Dr
- 203 Saint Pierre St
- 6637 Merwin Rd
- 1011 Bluffpoint Dr
- 999 Bluffpoint Dr
- 1025 Bluffpoint Dr
- 1016 Adin Trail
- 1004 Adin Trail
- 985 Bluffpoint Dr
- 7082 Bluffpoint Ct
- 1024 Bluffpoint Dr
- 1012 Bluffpoint Dr
- 994 Adin Trail
- 7090 Bluffpoint Ct
- 1000 Bluffpoint Dr
- 1032 Bluffpoint Dr
- 1015 Adin Trail
- 977 Bluffpoint Dr
- 988 Bluffpoint Dr
- 1046 Bluffpoint Dr
- 982 Adin Trail
- 7074 Bluffpoint Ct
- 1001 Adin Trail