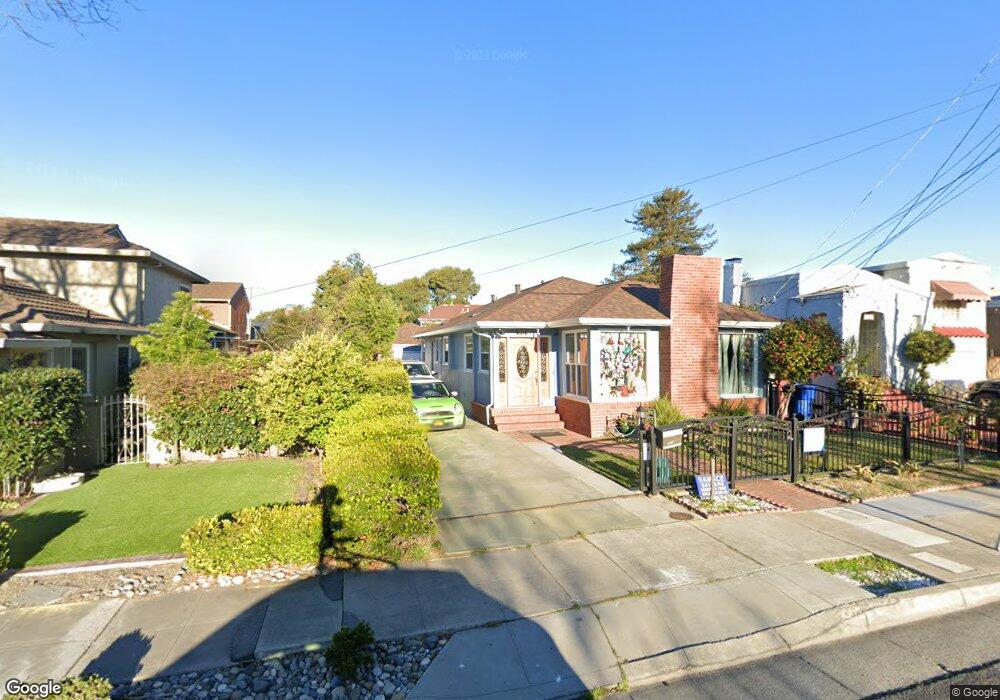
1011 Broadway Alameda, CA 94501
South Shore NeighborhoodEstimated Value: $971,000 - $1,313,000
2
Beds
1
Bath
1,260
Sq Ft
$891/Sq Ft
Est. Value
About This Home
This home is located at 1011 Broadway, Alameda, CA 94501 and is currently estimated at $1,122,176, approximately $890 per square foot. 1011 Broadway is a home located in Alameda County with nearby schools including Frank Otis Elementary School, Lincoln Middle School, and Alameda High School.
Ownership History
Date
Name
Owned For
Owner Type
Purchase Details
Closed on
Mar 4, 2009
Sold by
Hernandez Fabiola J
Bought by
Sanchez Rafael Hernandez
Current Estimated Value
Purchase Details
Closed on
Feb 17, 2009
Sold by
Jp Morgan Chase National Association
Bought by
Sanchez Rafael Hernandez
Purchase Details
Closed on
Nov 5, 2008
Sold by
Doan Hong Hai and Trinh Nga
Bought by
Jpmorgan Chase Bank National Association and Washington Mutual Bank
Purchase Details
Closed on
Sep 26, 2005
Sold by
Heathershaw Annie B and Annie B Heathershaw Living Tru
Bought by
Doan Hong Hai and Trinh Nga
Home Financials for this Owner
Home Financials are based on the most recent Mortgage that was taken out on this home.
Original Mortgage
$420,000
Interest Rate
5.75%
Mortgage Type
Purchase Money Mortgage
Purchase Details
Closed on
Oct 20, 1994
Sold by
Heathershaw Annie B
Bought by
Heathershaw Annie B
Create a Home Valuation Report for This Property
The Home Valuation Report is an in-depth analysis detailing your home's value as well as a comparison with similar homes in the area
Home Values in the Area
Average Home Value in this Area
Purchase History
| Date | Buyer | Sale Price | Title Company |
|---|---|---|---|
| Sanchez Rafael Hernandez | -- | Servicelink | |
| Sanchez Rafael Hernandez | $390,000 | None Available | |
| Jpmorgan Chase Bank National Association | $439,198 | None Available | |
| Doan Hong Hai | $560,000 | Alliance Title Company | |
| Heathershaw Annie B | -- | -- |
Source: Public Records
Mortgage History
| Date | Status | Borrower | Loan Amount |
|---|---|---|---|
| Previous Owner | Doan Hong Hai | $420,000 |
Source: Public Records
Tax History
| Year | Tax Paid | Tax Assessment Tax Assessment Total Assessment is a certain percentage of the fair market value that is determined by local assessors to be the total taxable value of land and additions on the property. | Land | Improvement |
|---|---|---|---|---|
| 2025 | $7,974 | $508,644 | $150,657 | $357,987 |
| 2024 | $7,974 | $498,674 | $147,704 | $350,970 |
| 2023 | $7,683 | $488,897 | $144,808 | $344,089 |
| 2022 | $7,516 | $479,315 | $141,970 | $337,345 |
| 2021 | $7,338 | $469,917 | $139,186 | $330,731 |
| 2020 | $7,250 | $465,102 | $137,760 | $327,342 |
| 2019 | $6,810 | $455,985 | $135,060 | $320,925 |
| 2018 | $6,562 | $447,046 | $132,412 | $314,634 |
| 2017 | $6,274 | $438,281 | $129,816 | $308,465 |
| 2016 | $6,272 | $429,689 | $127,271 | $302,418 |
| 2015 | $6,249 | $423,238 | $125,360 | $297,878 |
| 2014 | $5,977 | $414,951 | $122,906 | $292,045 |
Source: Public Records
Map
Nearby Homes
- 1100 Park Ave
- 954 Park St
- 976 Park St
- 1241 Park Ave
- 2312 San Antonio Ave
- 1251 Park St
- 2214 Clinton Ave
- 2417 Marti Rae Ct
- 2608 Central Ave
- 2137 Otis Dr Unit 111
- 1308 Court St
- 2515 Central Ave Unit 203
- 2101 Shoreline Dr Unit 153
- 2101 Shoreline Dr Unit 475
- 2106 Otis Dr Unit A
- 2959 Sea View Pkwy
- 2031 Otis Dr Unit H
- 3248 Briggs Ave
- 2118 Alameda Ave
- 1601 Broadway Unit 9
Your Personal Tour Guide
Ask me questions while you tour the home.