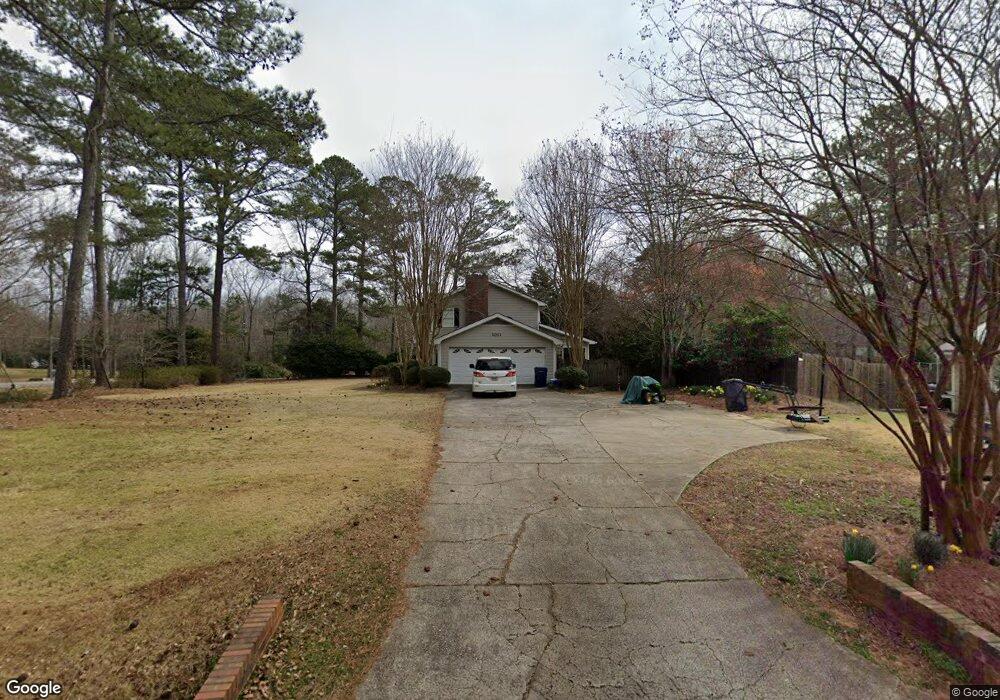
1011 Cantebury Rd Watkinsville, GA 30677
Estimated Value: $519,784 - $544,000
--
Bed
--
Bath
2,464
Sq Ft
$215/Sq Ft
Est. Value
About This Home
This home is located at 1011 Cantebury Rd, Watkinsville, GA 30677 and is currently estimated at $529,446, approximately $214 per square foot. 1011 Cantebury Rd is a home located in Oconee County with nearby schools including Oconee County Primary School, Oconee County Elementary School, and Oconee County Middle School.
Ownership History
Date
Name
Owned For
Owner Type
Purchase Details
Closed on
Mar 24, 2021
Sold by
Campagna Marc
Bought by
Campagna Marc A and Campagna Lisa
Current Estimated Value
Home Financials for this Owner
Home Financials are based on the most recent Mortgage that was taken out on this home.
Original Mortgage
$179,000
Outstanding Balance
$160,999
Interest Rate
2.9%
Mortgage Type
New Conventional
Estimated Equity
$368,447
Purchase Details
Closed on
Jul 17, 2017
Sold by
Hasler James A
Bought by
Campagna Marc A
Home Financials for this Owner
Home Financials are based on the most recent Mortgage that was taken out on this home.
Original Mortgage
$160,000
Interest Rate
3.91%
Mortgage Type
New Conventional
Purchase Details
Closed on
Aug 5, 2005
Sold by
Hasler James A
Bought by
Hasler James A and Hasler Stacey L
Purchase Details
Closed on
Feb 21, 2003
Sold by
Hasier James A
Bought by
Hasler James A
Purchase Details
Closed on
Feb 20, 2003
Sold by
Willis James Rigdon and Willis Pamela G
Bought by
Hasier James A
Create a Home Valuation Report for This Property
The Home Valuation Report is an in-depth analysis detailing your home's value as well as a comparison with similar homes in the area
Home Values in the Area
Average Home Value in this Area
Purchase History
| Date | Buyer | Sale Price | Title Company |
|---|---|---|---|
| Campagna Marc A | -- | -- | |
| Campagna Marc | -- | -- | |
| Campagna Marc A | $279,000 | -- | |
| Hasler James A | -- | -- | |
| Hasler James A | -- | -- | |
| Hasier James A | $214,000 | -- |
Source: Public Records
Mortgage History
| Date | Status | Borrower | Loan Amount |
|---|---|---|---|
| Open | Campagna Marc | $179,000 | |
| Previous Owner | Campagna Marc A | $160,000 |
Source: Public Records
Tax History Compared to Growth
Tax History
| Year | Tax Paid | Tax Assessment Tax Assessment Total Assessment is a certain percentage of the fair market value that is determined by local assessors to be the total taxable value of land and additions on the property. | Land | Improvement |
|---|---|---|---|---|
| 2024 | $3,011 | $163,161 | $28,600 | $134,561 |
| 2023 | $3,011 | $150,134 | $28,000 | $122,134 |
| 2022 | $2,897 | $137,036 | $28,000 | $109,036 |
| 2021 | $2,783 | $122,228 | $22,000 | $100,228 |
| 2020 | $2,707 | $118,742 | $22,000 | $96,742 |
| 2019 | $2,520 | $110,689 | $18,000 | $92,689 |
| 2018 | $2,488 | $107,056 | $18,000 | $89,056 |
| 2017 | $2,130 | $89,927 | $18,000 | $71,927 |
| 2016 | $2,206 | $93,130 | $18,000 | $75,130 |
| 2015 | $2,045 | $86,137 | $18,000 | $68,137 |
| 2014 | $2,036 | $83,818 | $18,000 | $65,818 |
| 2013 | -- | $82,360 | $18,000 | $64,360 |
Source: Public Records
Map
Nearby Homes
- 1322 Burr Harris Rd
- 1350 Burr Harris Rd
- Everett with Crawl Space Plan at Willow Creek
- Fairmont with Crawl Space Plan at Willow Creek
- Bristol with Basement Plan at Willow Creek
- Everett with Basement Plan at Willow Creek
- Fairmont with Basement Plan at Willow Creek
- Bristol with Crawl Space Plan at Willow Creek
- 1360 Longleaf Ct
- 2261 Willow Creek Dr
- 2091 Sycamore Cir
- 4280 Willow Creek Dr
- 4220 Willow Creek Dr
- 3065 Meadow Springs Dr
- 1151 Bouldercrest Cir
- 1105 Cold Tree Ln
- 1021 Steeple Chase Ct
- 1311 Crabapple Cir
- 1011 Canterbury Ct
- 1011 Cantebury Rd
- 1041 Cantebury Rd
- 1261 Robinhood Rd
- 1041 Cantebury Rd
- 1010 Cantebury Rd
- 0 Canterbury Ct
- 1280 Robinhood Rd
- 1300 Robinhood Rd
- 1241 Robinhood Rd
- 1270 Robinhood Rd
- 1030 Canterbury Ct
- 1030 Cantebury Rd
- 1030 Cantebury Rd
- 1021 Bowman Way
- 1321 Robinhood Rd
- 1561 Robinhood Rd
- 1320 Robinhood Rd
- 1021 Little John Ct
- 1541 Robinhood Rd