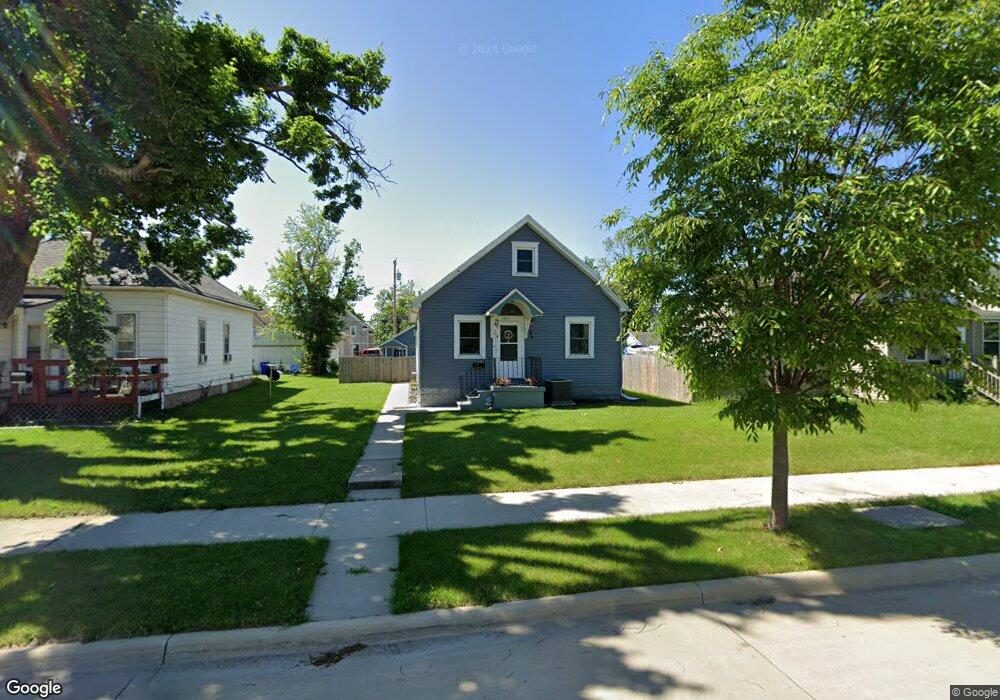
1011 E Ave NW Cedar Rapids, IA 52405
Northwest Area NeighborhoodEstimated Value: $141,000 - $162,000
2
Beds
2
Baths
1,106
Sq Ft
$139/Sq Ft
Est. Value
About This Home
This home is located at 1011 E Ave NW, Cedar Rapids, IA 52405 and is currently estimated at $153,449, approximately $138 per square foot. 1011 E Ave NW is a home located in Linn County with nearby schools including Harrison Elementary School, Roosevelt Creative Corridor Business Academy, and Thomas Jefferson High School.
Ownership History
Date
Name
Owned For
Owner Type
Purchase Details
Closed on
Jan 29, 2006
Sold by
Schoner Tina R and Schoner Kevin T
Bought by
Stangland Marsha L
Current Estimated Value
Home Financials for this Owner
Home Financials are based on the most recent Mortgage that was taken out on this home.
Original Mortgage
$72,290
Outstanding Balance
$41,033
Interest Rate
6.34%
Mortgage Type
FHA
Estimated Equity
$112,416
Purchase Details
Closed on
Jan 10, 2005
Sold by
Lathrop Minnie A and Cutler Carol S
Bought by
Schoner Tina R and Schoner Kevin T
Home Financials for this Owner
Home Financials are based on the most recent Mortgage that was taken out on this home.
Original Mortgage
$57,150
Interest Rate
5.83%
Mortgage Type
Credit Line Revolving
Create a Home Valuation Report for This Property
The Home Valuation Report is an in-depth analysis detailing your home's value as well as a comparison with similar homes in the area
Home Values in the Area
Average Home Value in this Area
Purchase History
| Date | Buyer | Sale Price | Title Company |
|---|---|---|---|
| Stangland Marsha L | $72,500 | None Available | |
| Schoner Tina R | $63,000 | -- |
Source: Public Records
Mortgage History
| Date | Status | Borrower | Loan Amount |
|---|---|---|---|
| Open | Stangland Marsha L | $72,290 | |
| Previous Owner | Schoner Tina R | $57,150 |
Source: Public Records
Tax History
| Year | Tax Paid | Tax Assessment Tax Assessment Total Assessment is a certain percentage of the fair market value that is determined by local assessors to be the total taxable value of land and additions on the property. | Land | Improvement |
|---|---|---|---|---|
| 2025 | $2,074 | $145,300 | $33,800 | $111,500 |
| 2024 | $2,044 | $136,100 | $31,300 | $104,800 |
| 2023 | $2,044 | $127,700 | $27,500 | $100,200 |
| 2022 | $1,782 | $105,800 | $27,500 | $78,300 |
| 2021 | $1,890 | $95,000 | $27,500 | $67,500 |
| 2020 | $1,890 | $94,300 | $25,000 | $69,300 |
| 2019 | $1,660 | $85,500 | $20,000 | $65,500 |
Source: Public Records
Map
Nearby Homes
Your Personal Tour Guide
Ask me questions while you tour the home.