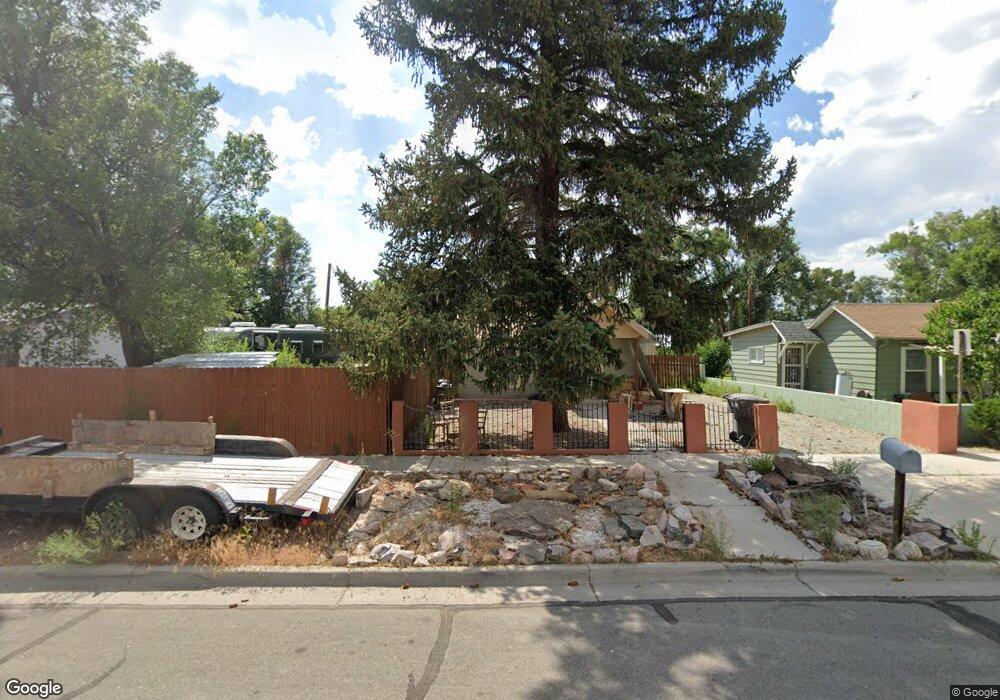
1011 East Ave Alamosa, CO 81101
Estimated Value: $151,000 - $185,000
2
Beds
1
Bath
768
Sq Ft
$215/Sq Ft
Est. Value
About This Home
This home is located at 1011 East Ave, Alamosa, CO 81101 and is currently estimated at $164,923, approximately $214 per square foot. 1011 East Ave is a home located in Alamosa County with nearby schools including Alamosa Elementary School, Ortega Middle School, and Alamosa High School.
Ownership History
Date
Name
Owned For
Owner Type
Purchase Details
Closed on
Mar 22, 2022
Sold by
Quirico Jimmy B
Bought by
Lopez Jose
Current Estimated Value
Purchase Details
Closed on
Mar 9, 1999
Sold by
Torres Robert L
Bought by
Quirico Jimmy B and Allen Karen B
Purchase Details
Closed on
Jul 12, 1995
Sold by
Ross Marveen and Mcross Dorothy Mc
Bought by
Mckinney Dorothy and Torres Robert L
Purchase Details
Closed on
Feb 11, 1995
Sold by
Mckinney Dorothy and Torres Robert L
Bought by
Torres Robert L
Purchase Details
Closed on
Mar 5, 1974
Bought by
Ross Marveen and Mcross Dorothy Mc
Create a Home Valuation Report for This Property
The Home Valuation Report is an in-depth analysis detailing your home's value as well as a comparison with similar homes in the area
Home Values in the Area
Average Home Value in this Area
Purchase History
| Date | Buyer | Sale Price | Title Company |
|---|---|---|---|
| Lopez Jose | $25,000 | None Listed On Document | |
| Quirico Jimmy B | $30,000 | -- | |
| Mckinney Dorothy | $17,000 | -- | |
| Torres Robert L | -- | -- | |
| Ross Marveen | -- | -- |
Source: Public Records
Tax History Compared to Growth
Tax History
| Year | Tax Paid | Tax Assessment Tax Assessment Total Assessment is a certain percentage of the fair market value that is determined by local assessors to be the total taxable value of land and additions on the property. | Land | Improvement |
|---|---|---|---|---|
| 2024 | $314 | $7,925 | $1,018 | $6,907 |
| 2023 | $321 | $8,002 | $1,028 | $6,974 |
| 2022 | $451 | $5,866 | $706 | $5,160 |
| 2021 | $464 | $5,866 | $706 | $5,160 |
| 2020 | $393 | $5,866 | $706 | $5,160 |
| 2019 | $394 | $4,878 | $706 | $4,172 |
| 2018 | $380 | $4,620 | $711 | $3,909 |
| 2017 | $380 | $4,620 | $711 | $3,909 |
| 2016 | $472 | $5,757 | $786 | $4,971 |
| 2015 | $471 | $5,757 | $786 | $4,971 |
| 2014 | -- | $5,758 | $786 | $4,972 |
| 2013 | -- | $5,758 | $786 | $4,972 |
Source: Public Records
Map
Nearby Homes