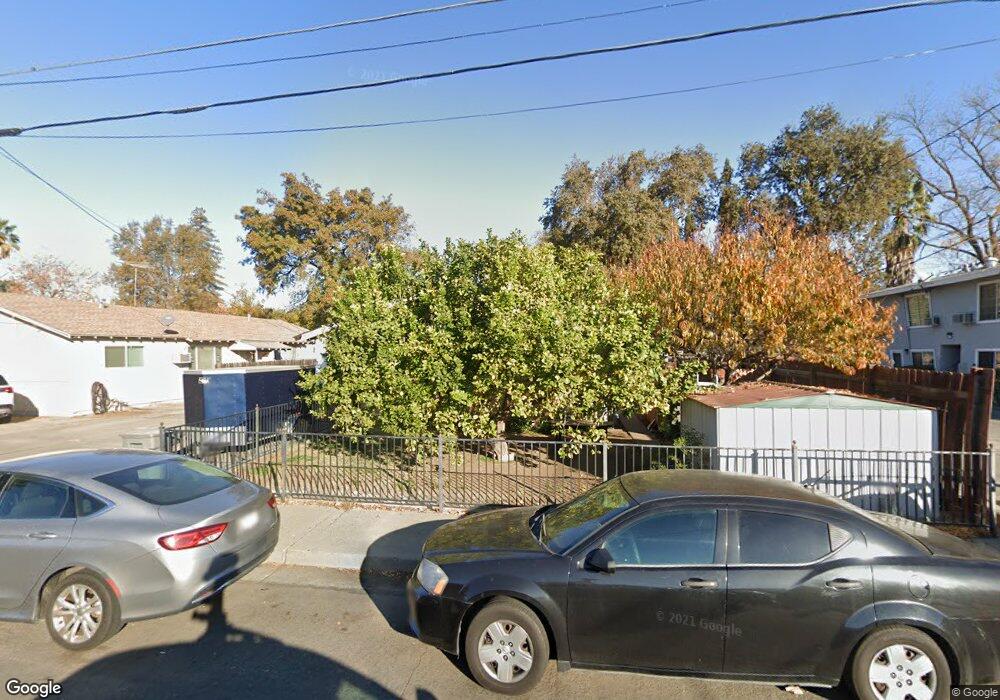
1011 Elliot St Unit 15 Woodland, CA 95695
Estimated Value: $446,000 - $512,486
6
Beds
2
Baths
1,950
Sq Ft
$247/Sq Ft
Est. Value
About This Home
This home is located at 1011 Elliot St Unit 15, Woodland, CA 95695 and is currently estimated at $482,372, approximately $247 per square foot. 1011 Elliot St Unit 15 is a home located in Yolo County with nearby schools including Beamer Elementary School, Douglass Middle School, and Pioneer High School.
Ownership History
Date
Name
Owned For
Owner Type
Purchase Details
Closed on
Oct 18, 2021
Sold by
Garcia Isidro and Garcia Guadalupe
Bought by
Dela Torre Juan Francisco and De La Torre
Current Estimated Value
Home Financials for this Owner
Home Financials are based on the most recent Mortgage that was taken out on this home.
Original Mortgage
$218,762
Outstanding Balance
$199,491
Interest Rate
2.8%
Mortgage Type
FHA
Estimated Equity
$282,881
Purchase Details
Closed on
May 15, 1995
Sold by
Eberlein Richard Gaylon and Eberlein Suzanne Angelika
Bought by
Garcia Isidro and Garcia Lupe
Home Financials for this Owner
Home Financials are based on the most recent Mortgage that was taken out on this home.
Original Mortgage
$116,375
Interest Rate
8.32%
Create a Home Valuation Report for This Property
The Home Valuation Report is an in-depth analysis detailing your home's value as well as a comparison with similar homes in the area
Home Values in the Area
Average Home Value in this Area
Purchase History
| Date | Buyer | Sale Price | Title Company |
|---|---|---|---|
| Dela Torre Juan Francisco | -- | Placer Title Company | |
| Garcia Isidro | $122,500 | North American Title Company |
Source: Public Records
Mortgage History
| Date | Status | Borrower | Loan Amount |
|---|---|---|---|
| Open | Dela Torre Juan Francisco | $218,762 | |
| Closed | Garcia Isidro | $116,375 |
Source: Public Records
Tax History Compared to Growth
Tax History
| Year | Tax Paid | Tax Assessment Tax Assessment Total Assessment is a certain percentage of the fair market value that is determined by local assessors to be the total taxable value of land and additions on the property. | Land | Improvement |
|---|---|---|---|---|
| 2025 | $3,738 | $362,598 | $100,789 | $261,809 |
| 2023 | $3,738 | $348,520 | $96,876 | $251,644 |
| 2022 | $3,592 | $341,687 | $94,977 | $246,710 |
| 2021 | $2,052 | $194,487 | $93,093 | $101,394 |
| 2020 | $2,023 | $192,494 | $92,139 | $100,355 |
| 2019 | $1,985 | $188,721 | $90,333 | $98,388 |
| 2018 | $1,965 | $185,021 | $88,562 | $96,459 |
| 2017 | $1,922 | $181,394 | $86,826 | $94,568 |
| 2016 | $1,889 | $177,838 | $85,124 | $92,714 |
| 2015 | $1,826 | $175,168 | $83,846 | $91,322 |
| 2014 | $1,826 | $171,738 | $82,204 | $89,534 |
Source: Public Records
Map
Nearby Homes