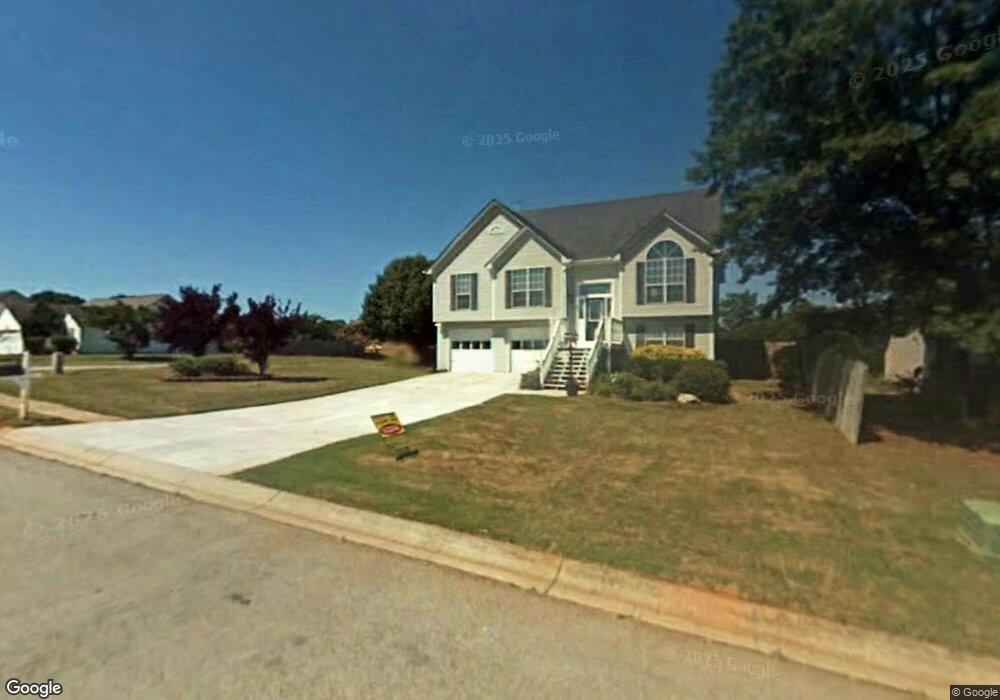
1011 Foxchase Dr McDonough, GA 30253
Estimated Value: $245,000 - $256,000
4
Beds
3
Baths
1,366
Sq Ft
$185/Sq Ft
Est. Value
About This Home
This home is located at 1011 Foxchase Dr, McDonough, GA 30253 and is currently estimated at $252,291, approximately $184 per square foot. 1011 Foxchase Dr is a home located in Henry County with nearby schools including Walnut Creek Elementary School, McDonough Middle School, and McDonough Methodist Academy.
Ownership History
Date
Name
Owned For
Owner Type
Purchase Details
Closed on
Oct 21, 2008
Sold by
Fremont Investment & Loan
Bought by
Fremont Trust 2005-D
Current Estimated Value
Home Financials for this Owner
Home Financials are based on the most recent Mortgage that was taken out on this home.
Original Mortgage
$89,495
Outstanding Balance
$59,011
Interest Rate
6.34%
Mortgage Type
FHA
Estimated Equity
$193,280
Purchase Details
Closed on
Oct 1, 2008
Sold by
Fremont Trust 2005-D
Bought by
Dacosta Dianne D
Home Financials for this Owner
Home Financials are based on the most recent Mortgage that was taken out on this home.
Original Mortgage
$89,495
Outstanding Balance
$59,011
Interest Rate
6.34%
Mortgage Type
FHA
Estimated Equity
$193,280
Purchase Details
Closed on
Mar 4, 2008
Sold by
Dingler Michael J
Bought by
Fremont Investment & Loans
Purchase Details
Closed on
May 12, 1995
Sold by
Jerry Steele Development Inc
Bought by
Dingler Michael Pamela
Create a Home Valuation Report for This Property
The Home Valuation Report is an in-depth analysis detailing your home's value as well as a comparison with similar homes in the area
Home Values in the Area
Average Home Value in this Area
Purchase History
| Date | Buyer | Sale Price | Title Company |
|---|---|---|---|
| Fremont Trust 2005-D | $90,900 | -- | |
| Dacosta Dianne D | $90,900 | -- | |
| Fremont Investment & Loans | $98,250 | -- | |
| Dingler Michael Pamela | $92,900 | -- |
Source: Public Records
Mortgage History
| Date | Status | Borrower | Loan Amount |
|---|---|---|---|
| Open | Dacosta Dianne D | $89,495 |
Source: Public Records
Tax History Compared to Growth
Tax History
| Year | Tax Paid | Tax Assessment Tax Assessment Total Assessment is a certain percentage of the fair market value that is determined by local assessors to be the total taxable value of land and additions on the property. | Land | Improvement |
|---|---|---|---|---|
| 2025 | $4,157 | $111,440 | $14,000 | $97,440 |
| 2024 | $4,157 | $99,960 | $14,000 | $85,960 |
| 2023 | $3,708 | $98,760 | $11,200 | $87,560 |
| 2022 | $3,080 | $80,080 | $11,200 | $68,880 |
| 2021 | $2,404 | $61,080 | $11,200 | $49,880 |
| 2020 | $2,234 | $56,400 | $10,000 | $46,400 |
| 2019 | $2,126 | $52,120 | $10,000 | $42,120 |
| 2018 | $1,879 | $45,960 | $8,000 | $37,960 |
| 2016 | $1,693 | $40,880 | $7,200 | $33,680 |
| 2015 | $1,599 | $37,040 | $7,200 | $29,840 |
| 2014 | $1,382 | $32,480 | $6,000 | $26,480 |
Source: Public Records
Map
Nearby Homes
- 7030 Kingston Ln
- 7011 Regency Ln
- 1244 Faye Ct
- 7000 Regency Ln
- 90 Cabriolet Trail
- 204 Rankin Cir
- 4170 Monarch Dr
- 360 Atlanta St
- 0 Ivey Edwards Ln Unit 10409448
- 0 Ivey Edwards Ln Unit 10246400
- 271 Spring Creek Blvd
- 409 Hyder Ct
- 117 Tracy Ln
- 351 Hamilton Pointe Dr
- 121 Pinnacle Ln
- 415 Gracious Way
- 386 Waterfront Dr
- 105 Hamilton Pointe Dr
- 101 Pinnacle Ln
- 646 Autumn Leaf Cir
- 1021 Foxchase Dr
- 0 Huntington Dr Unit 8498810
- 0 Huntington Dr Unit 8737436
- 100 Foxchase Ct
- 201 Huntington Dr
- 1031 Foxchase Dr
- 7041 Kingston Ln
- 200 Huntington Dr
- 110 Foxchase Ct
- 1041 Foxchase Dr
- 211 Huntington Dr
- 7031 Kingston Ln
- 108 Belldown Ct
- 112 Belldown Ct
- 108 Belldown Ct Unit 27
- 112 Belldown Ct Unit 26
- 116 Belldown Ct
- 116 Belldown Ct Unit 25
- 120 Belldown Ct
- 120 Belldown Ct Unit 24