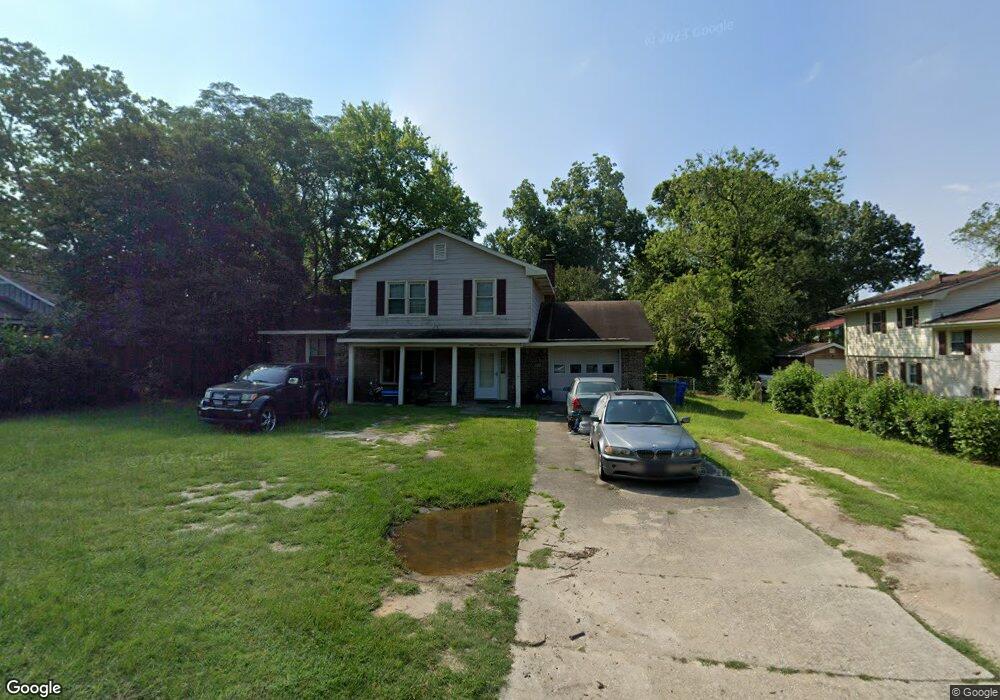
1011 Landau Rd Fayetteville, NC 28311
Lake Pines NeighborhoodEstimated Value: $227,161 - $250,000
3
Beds
3
Baths
1,792
Sq Ft
$131/Sq Ft
Est. Value
About This Home
This home is located at 1011 Landau Rd, Fayetteville, NC 28311 and is currently estimated at $235,040, approximately $131 per square foot. 1011 Landau Rd is a home located in Cumberland County with nearby schools including Westarea Elementary School, Luther Nick Jeralds Middle School, and E. E. Smith High School.
Ownership History
Date
Name
Owned For
Owner Type
Purchase Details
Closed on
Mar 3, 2025
Sold by
Ingram John M and Bethel Dacia L
Bought by
Ingram John M and Bethel Dacia L
Current Estimated Value
Purchase Details
Closed on
Mar 28, 2012
Sold by
Smiht Marion J
Bought by
Ingram John M
Home Financials for this Owner
Home Financials are based on the most recent Mortgage that was taken out on this home.
Original Mortgage
$120,856
Interest Rate
3.95%
Mortgage Type
FHA
Purchase Details
Closed on
Feb 7, 2003
Sold by
Powell Jimmie
Bought by
Smith I I I Marion
Home Financials for this Owner
Home Financials are based on the most recent Mortgage that was taken out on this home.
Original Mortgage
$89,150
Interest Rate
5.95%
Mortgage Type
VA
Create a Home Valuation Report for This Property
The Home Valuation Report is an in-depth analysis detailing your home's value as well as a comparison with similar homes in the area
Home Values in the Area
Average Home Value in this Area
Purchase History
| Date | Buyer | Sale Price | Title Company |
|---|---|---|---|
| Ingram John M | -- | None Listed On Document | |
| Ingram John M | -- | None Listed On Document | |
| Ingram John M | $124,000 | -- | |
| Smith I I I Marion | $82,500 | -- |
Source: Public Records
Mortgage History
| Date | Status | Borrower | Loan Amount |
|---|---|---|---|
| Previous Owner | Ingram John M | $120,856 | |
| Previous Owner | Smith I I I Marion | $89,150 |
Source: Public Records
Tax History Compared to Growth
Tax History
| Year | Tax Paid | Tax Assessment Tax Assessment Total Assessment is a certain percentage of the fair market value that is determined by local assessors to be the total taxable value of land and additions on the property. | Land | Improvement |
|---|---|---|---|---|
| 2024 | $2,952 | $123,957 | $18,000 | $105,957 |
| 2023 | $2,226 | $123,957 | $18,000 | $105,957 |
| 2022 | $1,989 | $123,957 | $18,000 | $105,957 |
| 2021 | $1,989 | $123,957 | $18,000 | $105,957 |
| 2019 | $1,954 | $126,000 | $18,000 | $108,000 |
| 2018 | $1,954 | $126,000 | $18,000 | $108,000 |
| 2017 | $1,851 | $126,000 | $18,000 | $108,000 |
| 2016 | $1,731 | $128,600 | $18,000 | $110,600 |
| 2015 | $1,714 | $128,600 | $18,000 | $110,600 |
| 2014 | $1,707 | $128,600 | $18,000 | $110,600 |
Source: Public Records
Map
Nearby Homes