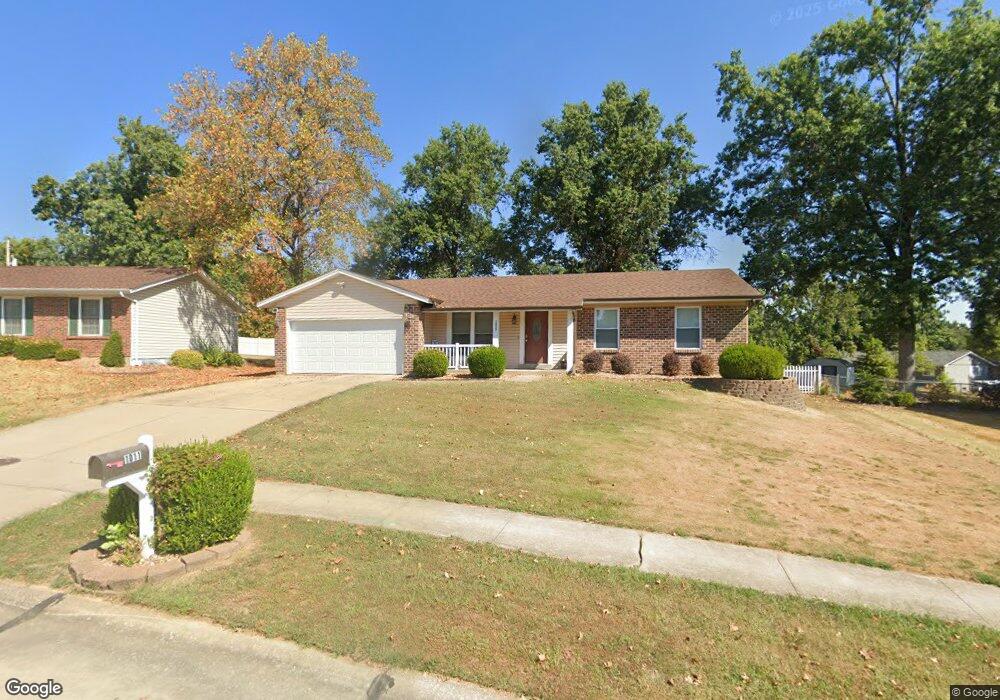
1011 Montbrook Dr O Fallon, MO 63366
Estimated Value: $277,010 - $312,000
3
Beds
2
Baths
1,292
Sq Ft
$230/Sq Ft
Est. Value
About This Home
This home is located at 1011 Montbrook Dr, O Fallon, MO 63366 and is currently estimated at $296,753, approximately $229 per square foot. 1011 Montbrook Dr is a home located in St. Charles County with nearby schools including Joseph L. Mudd Elementary School, Forest Park Elementary School, and Fort Zumwalt North Middle School.
Ownership History
Date
Name
Owned For
Owner Type
Purchase Details
Closed on
Mar 3, 2021
Sold by
Trueb Stephanie L and Lind James E
Bought by
Lind Stephanie L and Lind James E
Current Estimated Value
Purchase Details
Closed on
Jun 28, 2013
Sold by
Barnes James and Barnes Susan
Bought by
Trueb Stephanie L and Lind James E
Home Financials for this Owner
Home Financials are based on the most recent Mortgage that was taken out on this home.
Original Mortgage
$151,210
Outstanding Balance
$109,157
Interest Rate
3.75%
Mortgage Type
FHA
Estimated Equity
$187,596
Purchase Details
Closed on
Dec 13, 2012
Sold by
Bank Of New York Mellon
Bought by
Barnes James and Barnes Susan
Purchase Details
Closed on
Nov 13, 2012
Sold by
Marsh Clarence F and Marsh Leslie A
Bought by
Bank Of New York Mellon and The Bank Of New York
Create a Home Valuation Report for This Property
The Home Valuation Report is an in-depth analysis detailing your home's value as well as a comparison with similar homes in the area
Home Values in the Area
Average Home Value in this Area
Purchase History
| Date | Buyer | Sale Price | Title Company |
|---|---|---|---|
| Lind Stephanie L | -- | Investors Title Company | |
| Trueb Stephanie L | $154,000 | None Available | |
| Barnes James | $85,100 | Servicelink Lp | |
| Bank Of New York Mellon | $107,955 | None Available |
Source: Public Records
Mortgage History
| Date | Status | Borrower | Loan Amount |
|---|---|---|---|
| Open | Trueb Stephanie L | $151,210 |
Source: Public Records
Tax History
| Year | Tax Paid | Tax Assessment Tax Assessment Total Assessment is a certain percentage of the fair market value that is determined by local assessors to be the total taxable value of land and additions on the property. | Land | Improvement |
|---|---|---|---|---|
| 2025 | $2,890 | $45,684 | -- | -- |
| 2023 | $2,891 | $43,522 | $0 | $0 |
| 2022 | $2,433 | $33,995 | $0 | $0 |
| 2021 | $2,434 | $33,995 | $0 | $0 |
| 2020 | $2,411 | $32,666 | $0 | $0 |
| 2019 | $2,416 | $32,666 | $0 | $0 |
| 2018 | $2,147 | $27,681 | $0 | $0 |
| 2017 | $2,113 | $27,681 | $0 | $0 |
| 2016 | $1,820 | $23,743 | $0 | $0 |
| 2015 | $1,692 | $23,743 | $0 | $0 |
| 2014 | $1,641 | $22,650 | $0 | $0 |
Source: Public Records
Map
Nearby Homes
- 0 Montbrook Dr
- 302 Birmingham Dr
- 151 N Wellington St
- 24 Hawthorne Ct
- 849 Elaine Dr
- 11 Southern Hills Ct
- 10 Southern Hills Ct
- 962 Midpoint Dr
- 319 Magnolia Valley Dr
- 6 Emerson Ct
- 1117 Turtle Creek Dr
- 127 Columbia Meadows Ln
- 136 Columbia Meadows Ln
- 710 Longfellow Cir
- 5 Challenger Ct
- 4 Challenger Ct
- 1 Grand Columbia @ Columbia Meadows
- 1 Columbia @ Columbia Meadows
- 1 Grand Columbia II @ Columbia Meadows
- 105 Columbia Meadows Ln
- 1013 Montbrook Dr
- 1009 Montbrook Dr
- 64 Windbrook Ct
- 58 Westbrook Dr
- 66 Windbrook Ct
- 1012 Montbrook Dr
- 60 Westbrook Dr
- 1010 Montbrook Dr
- 62 Westbrook Dr
- 1102 Montbrook Dr
- 1105 Montbrook Dr
- 55 Westbrook Dr
- 314 San Jose Dr
- 68 Windbrook Ct
- 59 Westbrook Dr
- 57 Westbrook Dr
- 53 Westbrook Dr
- 316 San Jose Dr
- 52 Westbrook Dr
- 1104 Montbrook Dr
Your Personal Tour Guide
Ask me questions while you tour the home.