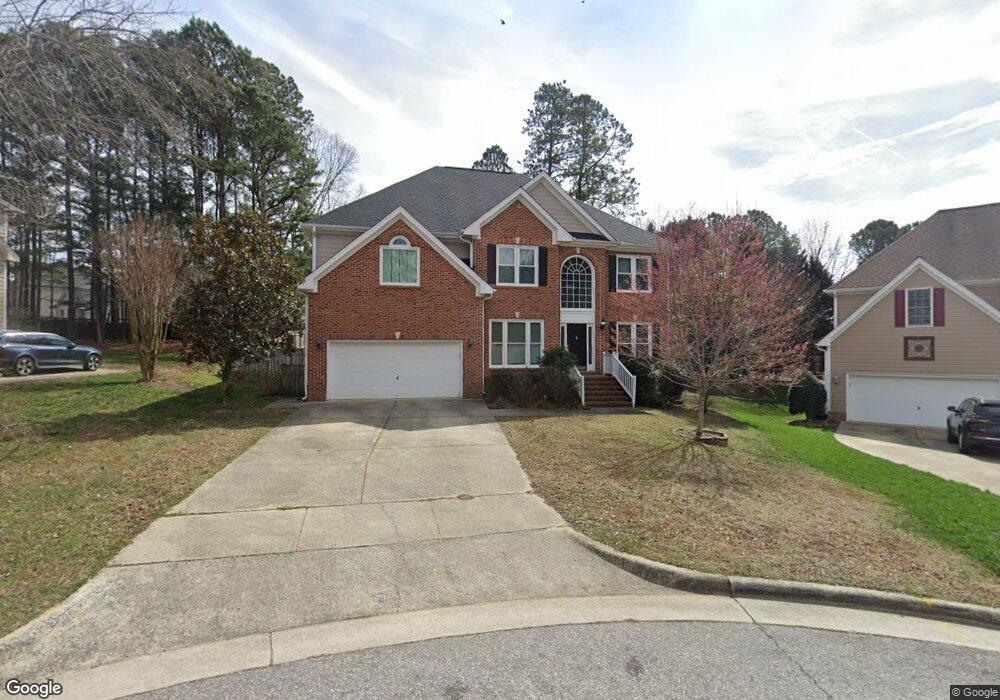
1011 Newington Way Apex, NC 27502
Beaver Creek NeighborhoodEstimated Value: $743,121 - $777,000
4
Beds
3
Baths
3,067
Sq Ft
$247/Sq Ft
Est. Value
About This Home
This home is located at 1011 Newington Way, Apex, NC 27502 and is currently estimated at $757,530, approximately $246 per square foot. 1011 Newington Way is a home located in Wake County with nearby schools including Salem Elementary, Salem Middle, and Apex High School.
Ownership History
Date
Name
Owned For
Owner Type
Purchase Details
Closed on
Feb 9, 2021
Sold by
Muir Justin L and Muir Anne D
Bought by
Keaton Alexander and Keaton Kelli
Current Estimated Value
Purchase Details
Closed on
Aug 20, 2004
Sold by
Melvin Lee A and Adams Melvin Bettina L
Bought by
Muir Justin L and Muir Anne D
Home Financials for this Owner
Home Financials are based on the most recent Mortgage that was taken out on this home.
Original Mortgage
$232,000
Interest Rate
5.96%
Mortgage Type
Purchase Money Mortgage
Purchase Details
Closed on
Jul 30, 1998
Sold by
St Lawrence Homes Inc
Bought by
Melvin Lee A and Adams Melvin Bettina L
Create a Home Valuation Report for This Property
The Home Valuation Report is an in-depth analysis detailing your home's value as well as a comparison with similar homes in the area
Home Values in the Area
Average Home Value in this Area
Purchase History
| Date | Buyer | Sale Price | Title Company |
|---|---|---|---|
| Keaton Alexander | $500,000 | None Available | |
| Keaton Alexander | $500,000 | None Listed On Document | |
| Muir Justin L | $310,000 | -- | |
| Melvin Lee A | $248,000 | -- |
Source: Public Records
Mortgage History
| Date | Status | Borrower | Loan Amount |
|---|---|---|---|
| Previous Owner | Muir Justin L | $232,000 |
Source: Public Records
Tax History Compared to Growth
Tax History
| Year | Tax Paid | Tax Assessment Tax Assessment Total Assessment is a certain percentage of the fair market value that is determined by local assessors to be the total taxable value of land and additions on the property. | Land | Improvement |
|---|---|---|---|---|
| 2025 | $6,199 | $707,751 | $190,000 | $517,751 |
| 2024 | $6,061 | $707,751 | $190,000 | $517,751 |
| 2023 | $4,735 | $429,785 | $92,000 | $337,785 |
| 2022 | $4,445 | $429,785 | $92,000 | $337,785 |
| 2021 | $4,275 | $429,785 | $92,000 | $337,785 |
| 2020 | $4,116 | $418,002 | $92,000 | $326,002 |
| 2019 | $4,094 | $358,758 | $92,000 | $266,758 |
| 2018 | $3,857 | $358,758 | $92,000 | $266,758 |
| 2017 | $3,590 | $358,758 | $92,000 | $266,758 |
| 2016 | $3,538 | $358,758 | $92,000 | $266,758 |
| 2015 | $3,570 | $353,444 | $84,000 | $269,444 |
| 2014 | $3,441 | $353,444 | $84,000 | $269,444 |
Source: Public Records
Map
Nearby Homes
- 907 Haddon Hall Dr
- 303 Knightsborough Way
- 1209 Haywards Heath Ln
- 102 Darley Dale Loop
- 232 Eyam Hall Ln
- 235 Eyam Hall Ln
- 427 Eyam Hall Ln
- 105 Troyer Place
- 1800 Pierre Place
- 506 W Chatham St
- 1105 Capitata Crossing
- 1116 Silky Dogwood Trail
- 7736 Roberts Rd
- 919 Branch Line Ln
- 202 W Chatham St
- 1111 Platform Dr
- 953 Ambergate Station
- 1115 Platform Dr
- 2008 Silky Dogwood Trail
- 3014 Silky Dogwood Trail
- 1007 Newington Way
- 1013 Newington Way
- 1002 Haywards Heath Ln
- 207 Hampstead Heath Ln
- 1014 Newington Way
- 205 Hampstead Heath Ln
- 101 Nottinghill Walk
- 203 Hampstead Heath Ln
- 1005 Newington Way
- 201 Hampstead Heath Ln
- 103 Nottinghill Walk
- 105 Nottinghill Walk
- 18 Nottinghill Walk
- 1000 Haywards Heath Ln
- 107 Nottinghill Walk
- 1008 Newington Way
- 2010 Leo Dr
- 2004 Leo Dr Unit Lot 110 Louisa
- 2002 Leo Dr Unit Lot 111 Louisa
- 1010 Newington Way