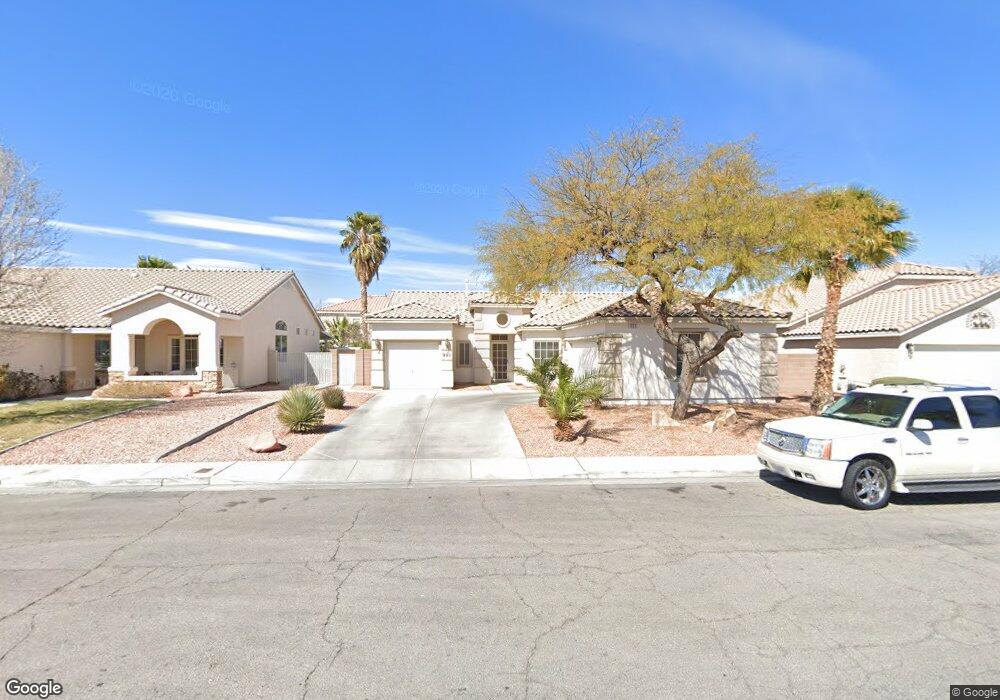
1011 Park Bridge Ave Unit 5 Las Vegas, NV 89123
Silverado Ranch NeighborhoodEstimated Value: $371,409 - $400,000
2
Beds
2
Baths
1,395
Sq Ft
$280/Sq Ft
Est. Value
About This Home
This home is located at 1011 Park Bridge Ave Unit 5, Las Vegas, NV 89123 and is currently estimated at $390,602, approximately $280 per square foot. 1011 Park Bridge Ave Unit 5 is a home located in Clark County with nearby schools including John R Beatty Elementary School, Jack Lund Schofield Middle School, and Silverado High School.
Ownership History
Date
Name
Owned For
Owner Type
Purchase Details
Closed on
Sep 2, 2004
Sold by
Fletcher Kim
Bought by
Santos Edgardo
Current Estimated Value
Home Financials for this Owner
Home Financials are based on the most recent Mortgage that was taken out on this home.
Original Mortgage
$200,000
Outstanding Balance
$96,563
Interest Rate
5.5%
Mortgage Type
Unknown
Estimated Equity
$294,039
Purchase Details
Closed on
Dec 23, 1997
Sold by
Bilt Perma
Bought by
Fletcher Kim
Home Financials for this Owner
Home Financials are based on the most recent Mortgage that was taken out on this home.
Original Mortgage
$112,093
Interest Rate
7.22%
Mortgage Type
FHA
Create a Home Valuation Report for This Property
The Home Valuation Report is an in-depth analysis detailing your home's value as well as a comparison with similar homes in the area
Home Values in the Area
Average Home Value in this Area
Purchase History
| Date | Buyer | Sale Price | Title Company |
|---|---|---|---|
| Santos Edgardo | $250,000 | Equity Title Of Nevada | |
| Fletcher Kim | $114,500 | Nevada Title Company |
Source: Public Records
Mortgage History
| Date | Status | Borrower | Loan Amount |
|---|---|---|---|
| Open | Santos Edgardo | $200,000 | |
| Previous Owner | Fletcher Kim | $112,093 | |
| Closed | Santos Edgardo | $37,500 |
Source: Public Records
Tax History Compared to Growth
Tax History
| Year | Tax Paid | Tax Assessment Tax Assessment Total Assessment is a certain percentage of the fair market value that is determined by local assessors to be the total taxable value of land and additions on the property. | Land | Improvement |
|---|---|---|---|---|
| 2025 | $1,422 | $80,351 | $31,500 | $48,851 |
| 2024 | $1,381 | $80,351 | $31,500 | $48,851 |
| 2023 | $1,114 | $76,883 | $30,450 | $46,433 |
| 2022 | $1,341 | $66,594 | $24,150 | $42,444 |
| 2021 | $1,302 | $63,569 | $23,100 | $40,469 |
| 2020 | $1,261 | $61,598 | $21,350 | $40,248 |
| 2019 | $1,246 | $58,886 | $19,250 | $39,636 |
| 2018 | $1,189 | $54,418 | $16,450 | $37,968 |
| 2017 | $1,550 | $52,492 | $14,350 | $38,142 |
| 2016 | $1,114 | $47,807 | $9,450 | $38,357 |
| 2015 | $1,111 | $42,886 | $8,050 | $34,836 |
| 2014 | $1,078 | $35,329 | $5,250 | $30,079 |
Source: Public Records
Map
Nearby Homes
- 1058 Warm Canyon Way
- 971 Whispering Grove Ave
- 1058 Silver Stone Way Unit 3
- 960 Clear Diamond Ave
- 1006 Coldwater Falls Way
- 927 Clear Diamond Ave
- 920 Clear Diamond Ave
- 896 Clear Diamond Ave
- 861 Clear Diamond Ave
- 8777 Shady Peak Way Unit 2
- 899 Hornbeak Ct
- 0 S Maryland Pkwy
- 8698 Waterford Bend St
- 8379 Drop Camp St
- 8378 Green Cedar Dr
- 8880 Star Valley Ct
- 8343 Rockefeller St
- 8870 Star Canyon Way
- 745 Diamond Bend Ave
- 1115 Aldenwood Ave
- 1003 Park Bridge Ave
- 1003 Park Bridge Ave
- 1003 Park Bridge Ave Unit n/a
- 1019 Park Bridge Ave
- 990 Marbelwood Ave Unit 6
- 995 Park Bridge Ave Unit 5
- 1027 Park Bridge Ave
- 1010 Park Bridge Ave
- 1000 Marbelwood Ave
- 1002 Park Bridge Ave
- 980 Marbelwood Ave
- 1018 Park Bridge Ave
- 987 Park Bridge Ave
- 1026 Park Bridge Ave Unit 5
- 1035 Park Bridge Ave
- 1010 Marbelwood Ave
- 1011 Meadow Bridge Ave
- 1003 Meadow Bridge Ave Unit 5
- 970 Marbelwood Ave
- 986 Park Bridge Ave Unit 5