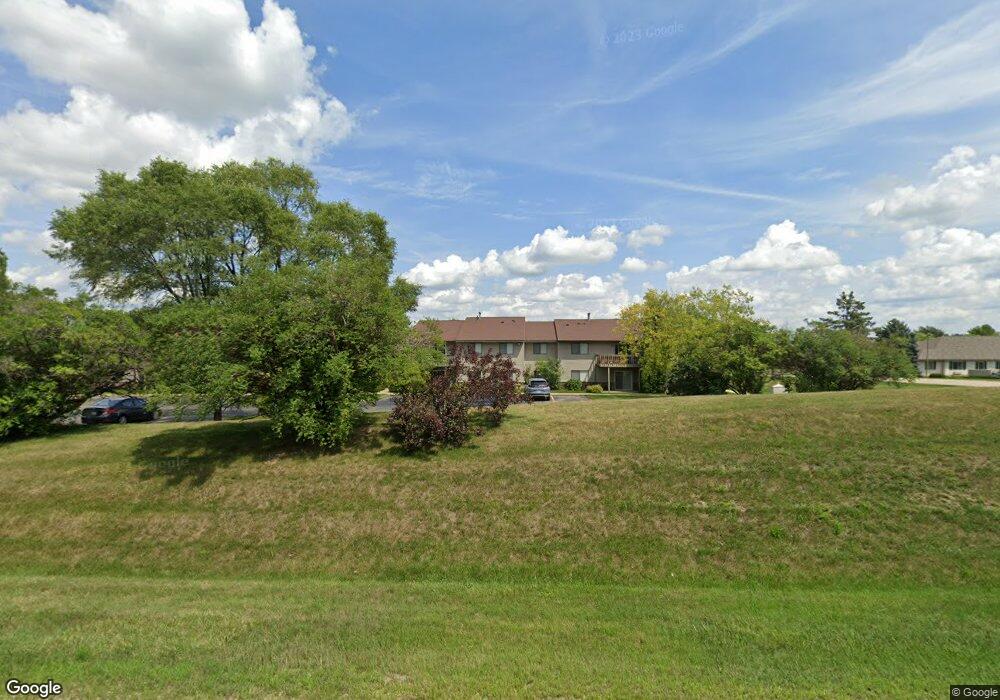
1011 S 2nd St Delavan, WI 53115
Estimated Value: $178,564 - $349,000
Studio
--
Bath
--
Sq Ft
109,902
Sq Ft Lot
About This Home
This home is located at 1011 S 2nd St, Delavan, WI 53115 and is currently estimated at $250,641. 1011 S 2nd St is a home located in Walworth County with nearby schools including Delavan-Darien High School, Delavan Christian School, and Our Redeemer Lutheran School.
Ownership History
Date
Name
Owned For
Owner Type
Purchase Details
Closed on
Sep 8, 2021
Sold by
Lee Kathleen A
Bought by
Lee Eileen K
Current Estimated Value
Home Financials for this Owner
Home Financials are based on the most recent Mortgage that was taken out on this home.
Original Mortgage
$109,600
Outstanding Balance
$98,635
Interest Rate
2.8%
Mortgage Type
New Conventional
Estimated Equity
$152,006
Purchase Details
Closed on
Aug 20, 2021
Sold by
Lenz Gaia C
Bought by
Lee Kathleen A
Home Financials for this Owner
Home Financials are based on the most recent Mortgage that was taken out on this home.
Original Mortgage
$109,600
Outstanding Balance
$98,635
Interest Rate
2.8%
Mortgage Type
New Conventional
Estimated Equity
$152,006
Purchase Details
Closed on
Sep 17, 2009
Sold by
Loudon Stephen and Loudon Victoria
Bought by
Lane Gala C
Home Financials for this Owner
Home Financials are based on the most recent Mortgage that was taken out on this home.
Original Mortgage
$93,000
Interest Rate
5.19%
Mortgage Type
New Conventional
Create a Home Valuation Report for This Property
The Home Valuation Report is an in-depth analysis detailing your home's value as well as a comparison with similar homes in the area
Home Values in the Area
Average Home Value in this Area
Purchase History
| Date | Buyer | Sale Price | Title Company |
|---|---|---|---|
| Lee Eileen K | -- | None Available | |
| Lee Kathleen A | $137,000 | Ct | |
| Lane Gala C | $93,000 | None Available |
Source: Public Records
Mortgage History
| Date | Status | Borrower | Loan Amount |
|---|---|---|---|
| Open | Lee Kathleen A | $109,600 | |
| Previous Owner | Lane Gala C | $93,000 |
Source: Public Records
Tax History
| Year | Tax Paid | Tax Assessment Tax Assessment Total Assessment is a certain percentage of the fair market value that is determined by local assessors to be the total taxable value of land and additions on the property. | Land | Improvement |
|---|---|---|---|---|
| 2025 | $2,248 | $159,000 | $7,500 | $151,500 |
| 2024 | $2,155 | $159,000 | $7,500 | $151,500 |
| 2023 | $1,589 | $82,800 | $5,000 | $77,800 |
| 2022 | $1,778 | $82,800 | $5,000 | $77,800 |
| 2021 | $1,767 | $82,800 | $5,000 | $77,800 |
| 2020 | $1,829 | $82,800 | $5,000 | $77,800 |
| 2019 | $1,838 | $82,800 | $5,000 | $77,800 |
| 2018 | $1,654 | $82,800 | $5,000 | $77,800 |
| 2017 | $1,811 | $79,700 | $3,000 | $76,700 |
| 2016 | $1,703 | $79,700 | $3,000 | $76,700 |
| 2015 | $1,751 | $79,700 | $3,000 | $76,700 |
| 2014 | $1,783 | $79,700 | $3,000 | $76,700 |
| 2013 | $1,783 | $79,700 | $3,000 | $76,700 |
Source: Public Records
Map
Nearby Homes
- 110 Eagle Pointe Dr Unit 3A
- 735 S 2nd St
- 410 E Geneva St
- 620 Bowers Blvd Unit 4
- 609 Madison Dr
- 210 E Wisconsin St
- 304 S Main St
- 235 S 7th St
- 608 E Washington St
- 2853 Launch Dr
- 2809 Launch Dr
- 2813 Launch Dr
- 315 S 8th St
- 132 S 2nd St
- 104 E Walworth Ave
- 717 E Walworth Ave
- 1118 Cottonwood St
- 930 E Wisconsin St
- 311 N 7th St
- 0 Elm Ridge Rd
- 1011 S Second St Unit 4
- 1011 S Second St Unit 1011
- 1011 S 2nd St
- 1011 S 2nd St
- 1011 S 2nd St
- 1011 S 2nd St
- 1011 S 2nd St
- 1011 S 2nd St
- 1011 S 2nd St
- 1011 S 2nd St
- 1011 S 2nd St
- 1011 S 2nd St
- 1011 S 2nd St
- 1011 S 2nd St
- 1011 S 2nd St
- 1011 S 2nd St
- 1011 S 2nd St
- 1011 S 2nd St Unit 4
- 1011 S 2nd St Unit 13
- 1011 S 2nd St Unit 11
Your Personal Tour Guide
Ask me questions while you tour the home.