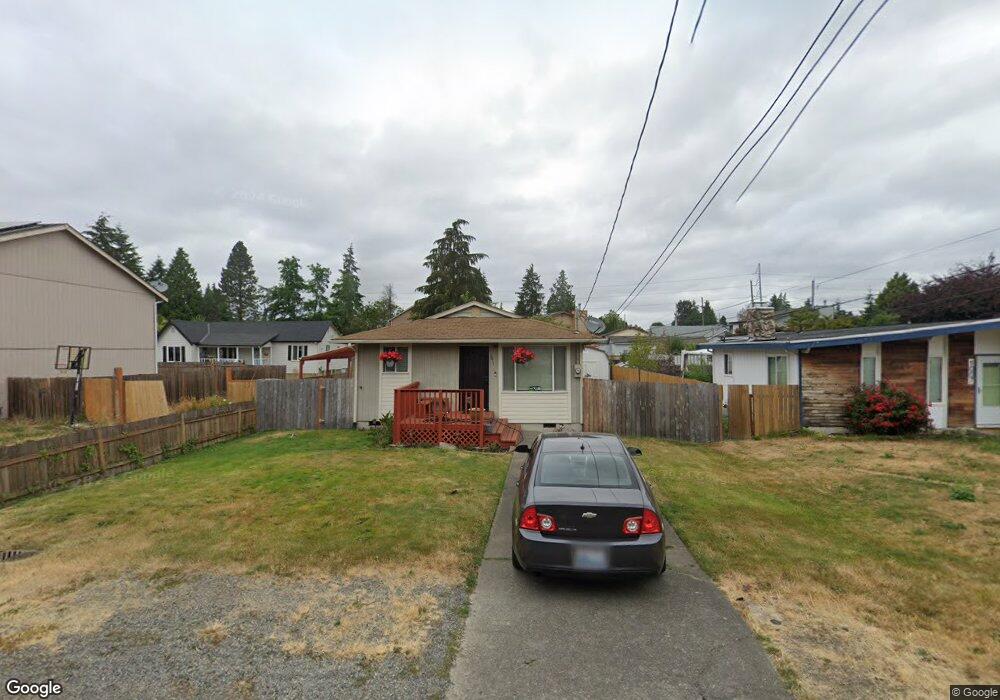
1011 S 74th St Tacoma, WA 98408
South End NeighborhoodEstimated Value: $379,000 - $424,000
3
Beds
1
Bath
1,104
Sq Ft
$367/Sq Ft
Est. Value
About This Home
This home is located at 1011 S 74th St, Tacoma, WA 98408 and is currently estimated at $404,639, approximately $366 per square foot. 1011 S 74th St is a home located in Pierce County with nearby schools including Birney Elementary School, Baker Middle School, and Mount Tahoma High School.
Ownership History
Date
Name
Owned For
Owner Type
Purchase Details
Closed on
Aug 27, 2009
Sold by
Books Roger P and Lee Sharon J
Bought by
Lee Sharon J
Current Estimated Value
Purchase Details
Closed on
May 7, 2003
Sold by
Lee Sharon J
Bought by
Books Roger P and Lee Sharon J
Home Financials for this Owner
Home Financials are based on the most recent Mortgage that was taken out on this home.
Original Mortgage
$107,350
Outstanding Balance
$46,384
Interest Rate
5.71%
Mortgage Type
Purchase Money Mortgage
Estimated Equity
$358,255
Purchase Details
Closed on
May 25, 2001
Sold by
Hong Chong Il
Bought by
Lee Sharon J
Home Financials for this Owner
Home Financials are based on the most recent Mortgage that was taken out on this home.
Original Mortgage
$105,839
Interest Rate
7.15%
Purchase Details
Closed on
Jan 26, 2001
Sold by
Johnson Alfonso L
Bought by
Hong Chong Il
Create a Home Valuation Report for This Property
The Home Valuation Report is an in-depth analysis detailing your home's value as well as a comparison with similar homes in the area
Home Values in the Area
Average Home Value in this Area
Purchase History
| Date | Buyer | Sale Price | Title Company |
|---|---|---|---|
| Lee Sharon J | -- | None Available | |
| Books Roger P | -- | Trans | |
| Lee Sharon J | $125,065 | Chicago Title Insurance Comp | |
| Hong Chong Il | $70,100 | -- |
Source: Public Records
Mortgage History
| Date | Status | Borrower | Loan Amount |
|---|---|---|---|
| Open | Books Roger P | $107,350 | |
| Closed | Lee Sharon J | $105,839 |
Source: Public Records
Tax History Compared to Growth
Tax History
| Year | Tax Paid | Tax Assessment Tax Assessment Total Assessment is a certain percentage of the fair market value that is determined by local assessors to be the total taxable value of land and additions on the property. | Land | Improvement |
|---|---|---|---|---|
| 2025 | $3,543 | $358,000 | $194,300 | $163,700 |
| 2024 | $3,543 | $345,500 | $187,600 | $157,900 |
| 2023 | $3,543 | $317,900 | $175,900 | $142,000 |
| 2022 | $3,254 | $341,000 | $172,000 | $169,000 |
| 2021 | $2,914 | $231,500 | $99,900 | $131,600 |
| 2019 | $2,448 | $209,100 | $83,500 | $125,600 |
| 2018 | $2,594 | $188,100 | $69,600 | $118,500 |
| 2017 | $2,255 | $164,000 | $55,500 | $108,500 |
| 2016 | $1,974 | $125,300 | $41,600 | $83,700 |
| 2014 | $1,808 | $113,400 | $37,200 | $76,200 |
| 2013 | $1,808 | $103,400 | $35,000 | $68,400 |
Source: Public Records
Map
Nearby Homes
- 7420 S J St
- 861 S 72nd St
- 807 S 74th St
- 7233 S Sheridan Ave
- 7021 S I St
- 7508 Park Ave S
- 7506 S Park Ave
- 6827 S Thompson Ave
- 7002 Park Ave S
- 1005 S 80th St
- 6826 S Park Ave
- 6819 S Park Ave
- 6202 S Sheridan Ave
- 7843 Yakima Ave
- 1402 S 80th St
- 7322 S Alaska St
- 8015 Yakima Ave
- 7817 S Asotin St
- 8027 S Sheridan Ave
- 0 Fawcett Ave Unit NWM2414863