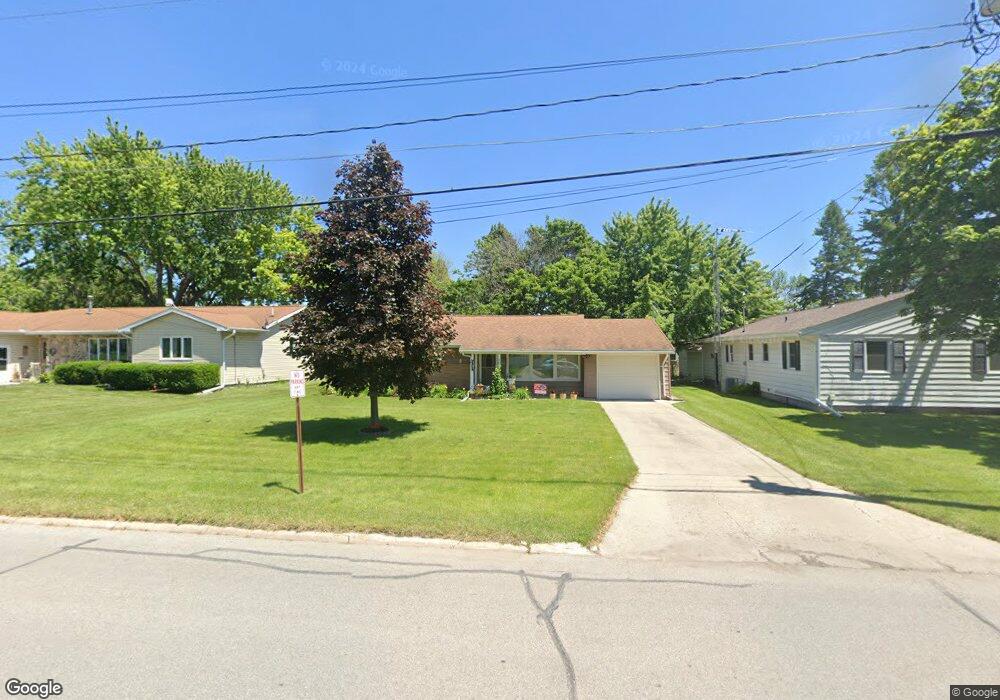
1011 S Main St Clarion, IA 50525
Estimated Value: $146,000 - $158,000
3
Beds
3
Baths
1,040
Sq Ft
$146/Sq Ft
Est. Value
About This Home
This home is located at 1011 S Main St, Clarion, IA 50525 and is currently estimated at $151,898, approximately $146 per square foot. 1011 S Main St is a home with nearby schools including Clarion-Goldfield-Dows Elementary School, Clarion-Goldfield-Dows Middle School, and Clarion-Goldfield-Dows High School.
Ownership History
Date
Name
Owned For
Owner Type
Purchase Details
Closed on
Apr 27, 2012
Sold by
Paustian David and Paustian Lillie Williams
Bought by
Bowman Dennis E and Bowman Carolyn A
Current Estimated Value
Home Financials for this Owner
Home Financials are based on the most recent Mortgage that was taken out on this home.
Original Mortgage
$73,500
Outstanding Balance
$30,736
Interest Rate
3.91%
Mortgage Type
FHA
Estimated Equity
$121,162
Create a Home Valuation Report for This Property
The Home Valuation Report is an in-depth analysis detailing your home's value as well as a comparison with similar homes in the area
Home Values in the Area
Average Home Value in this Area
Purchase History
| Date | Buyer | Sale Price | Title Company |
|---|---|---|---|
| Bowman Dennis E | $72,000 | None Available |
Source: Public Records
Mortgage History
| Date | Status | Borrower | Loan Amount |
|---|---|---|---|
| Open | Bowman Dennis E | $73,500 |
Source: Public Records
Tax History
| Year | Tax Paid | Tax Assessment Tax Assessment Total Assessment is a certain percentage of the fair market value that is determined by local assessors to be the total taxable value of land and additions on the property. | Land | Improvement |
|---|---|---|---|---|
| 2025 | $2,136 | $134,100 | $8,300 | $125,800 |
| 2024 | $2,136 | $111,500 | $8,300 | $103,200 |
| 2023 | $2,126 | $111,500 | $8,300 | $103,200 |
| 2022 | $1,786 | $94,300 | $8,300 | $86,000 |
| 2021 | $1,786 | $79,300 | $8,300 | $71,000 |
| 2020 | $1,768 | $79,200 | $8,300 | $70,900 |
| 2019 | $1,642 | $73,300 | $0 | $0 |
| 2018 | $1,654 | $73,300 | $0 | $0 |
| 2017 | $1,612 | $71,700 | $0 | $0 |
| 2016 | $1,548 | $71,700 | $0 | $0 |
| 2015 | $1,480 | $71,700 | $0 | $0 |
| 2014 | $1,480 | $66,400 | $0 | $0 |
Source: Public Records
Map
Nearby Homes
- 1000 1st St SE
- 219 8th Ave SE
- 1221 S Main St
- 1513 2nd St SW
- 120 1st Ave SE
- 212 3rd Ave NE
- 903 2nd Ave NE
- 1003 2nd Ave NE
- 519 6th St NE
- 609 4th St NW
- 620 Maple Ln
- 719 2nd St NE
- 720 3rd St NE
- 306 White Fox Dr
- 2412 188th St
- 2405 186th St Unit 1
- 2405 186th St Unit 2
- 1816 Obrien Ave
- 1881 Cornelia Dr
- 1831 Page Ave
Your Personal Tour Guide
Ask me questions while you tour the home.