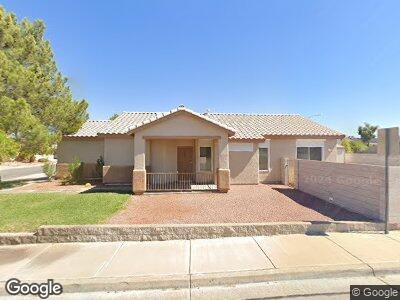
1011 Sojourn Ct Henderson, NV 89074
Gibson Springs NeighborhoodEstimated Value: $401,000 - $413,000
3
Beds
2
Baths
1,264
Sq Ft
$324/Sq Ft
Est. Value
About This Home
This home is located at 1011 Sojourn Ct, Henderson, NV 89074 and is currently estimated at $409,412, approximately $323 per square foot. 1011 Sojourn Ct is a home located in Clark County with nearby schools including Lorna J Kesterson Elementary School, Lyal Burkholder Middle School, and Foothill High School.
Ownership History
Date
Name
Owned For
Owner Type
Purchase Details
Closed on
Mar 15, 2005
Sold by
Dean Candice
Bought by
Kring Kathy D
Current Estimated Value
Home Financials for this Owner
Home Financials are based on the most recent Mortgage that was taken out on this home.
Original Mortgage
$228,000
Interest Rate
5.77%
Mortgage Type
Unknown
Purchase Details
Closed on
Aug 16, 2001
Sold by
Hernandez Katherine T
Bought by
Dean Candice
Home Financials for this Owner
Home Financials are based on the most recent Mortgage that was taken out on this home.
Original Mortgage
$139,500
Interest Rate
7.19%
Purchase Details
Closed on
Nov 2, 1998
Sold by
Gibson Ranch Ltd Liability Company
Bought by
Hernandez Katherine T
Home Financials for this Owner
Home Financials are based on the most recent Mortgage that was taken out on this home.
Original Mortgage
$109,050
Interest Rate
6.61%
Create a Home Valuation Report for This Property
The Home Valuation Report is an in-depth analysis detailing your home's value as well as a comparison with similar homes in the area
Home Values in the Area
Average Home Value in this Area
Purchase History
| Date | Buyer | Sale Price | Title Company |
|---|---|---|---|
| Kring Kathy D | $285,000 | First Amer Title Co Of Nv | |
| Dean Candice | $155,000 | United Title | |
| Hernandez Katherine T | $121,500 | National Title Company |
Source: Public Records
Mortgage History
| Date | Status | Borrower | Loan Amount |
|---|---|---|---|
| Open | Kring Kathy D | $289,700 | |
| Closed | Kring Kathy D | $228,000 | |
| Previous Owner | Dean Candice | $139,500 | |
| Previous Owner | Hernandez Katherine T | $109,050 | |
| Closed | Kring Kathy D | $57,000 |
Source: Public Records
Tax History Compared to Growth
Tax History
| Year | Tax Paid | Tax Assessment Tax Assessment Total Assessment is a certain percentage of the fair market value that is determined by local assessors to be the total taxable value of land and additions on the property. | Land | Improvement |
|---|---|---|---|---|
| 2025 | $1,572 | $88,984 | $41,300 | $47,684 |
| 2024 | $1,527 | $88,984 | $41,300 | $47,684 |
| 2023 | $1,527 | $83,182 | $37,975 | $45,207 |
| 2022 | $1,482 | $70,782 | $29,400 | $41,382 |
| 2021 | $1,439 | $68,051 | $28,700 | $39,351 |
| 2020 | $1,394 | $67,115 | $28,000 | $39,115 |
| 2019 | $1,354 | $63,502 | $24,850 | $38,652 |
| 2018 | $1,314 | $58,172 | $21,000 | $37,172 |
| 2017 | $1,648 | $56,866 | $19,250 | $37,616 |
| 2016 | $1,246 | $52,213 | $14,350 | $37,863 |
| 2015 | $1,242 | $47,876 | $11,550 | $36,326 |
| 2014 | $1,206 | $42,000 | $9,100 | $32,900 |
Source: Public Records
Map
Nearby Homes
- 272 Violet Note St
- 1035 Tabor Hill Ave
- 221 Oro Canyon St
- 1048 Painted Daisy Ave
- 1191 Starstone Ct
- 1211 Red Jade Ct
- 199 Bailey Island Dr
- 331 Mount Hope St
- 1195 Sunfire Ave
- 1219 Starstone Ct
- 1223 Starstone Ct
- 1197 Simms Ave
- 211 Crown Imperial St Unit 1202
- 205 Crown Imperial St Unit 1101
- 367 Monique Springs St
- 202 Twin Creek St
- 372 Monique Springs St
- 1107 Cloudy Day Dr
- 376 Shanon Springs St
- 1287 Dove Tree Ct
- 1011 Sojourn Ct
- 1009 Sojourn Ct
- 1007 Sojourn Ct
- 257 Ventana Heights St Unit 10A
- 259 Ventana Heights St Unit 10A
- 1010 Sojourn Ct Unit 10A
- 261 Ventana Heights St
- 1008 Sojourn Ct
- 1005 Sojourn Ct
- 1006 Sojourn Ct
- 263 Ventana Heights St
- 1010 Shell Flower Rd
- 1008 Shell Flower Rd Unit 12A
- 260 Violet Note St
- 1003 Sojourn Ct
- 1006 Shell Flower Rd
- 1004 Sojourn Ct
- 1017 Tabor Hill Ave
- 1014 Shell Flower Rd
- 1011 Tidal Foam Ct