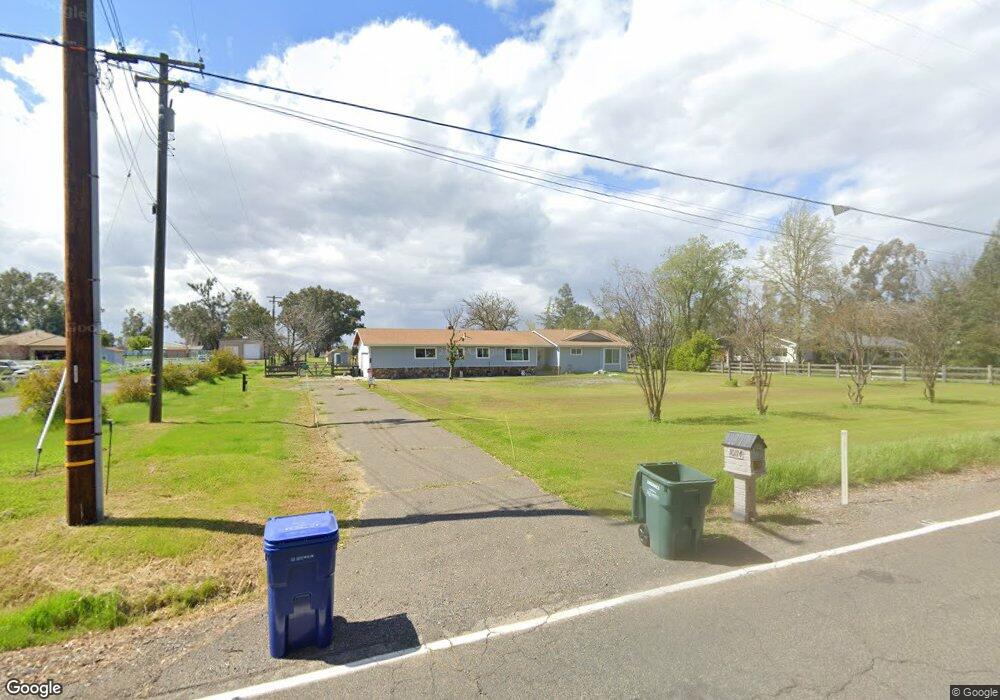
10114 Alta Mesa Rd Wilton, CA 95693
Estimated Value: $669,353 - $835,000
2
Beds
2
Baths
1,619
Sq Ft
$457/Sq Ft
Est. Value
About This Home
This home is located at 10114 Alta Mesa Rd, Wilton, CA 95693 and is currently estimated at $740,588, approximately $457 per square foot. 10114 Alta Mesa Rd is a home located in Sacramento County with nearby schools including C.W. Dillard Elementary School, Katherine L. Albiani Middle School, and Pleasant Grove High School.
Ownership History
Date
Name
Owned For
Owner Type
Purchase Details
Closed on
Jan 6, 2022
Sold by
Francis Schwall Jr Robert
Bought by
Schwall Violet Lynn
Current Estimated Value
Home Financials for this Owner
Home Financials are based on the most recent Mortgage that was taken out on this home.
Original Mortgage
$310,000
Outstanding Balance
$283,395
Interest Rate
3.12%
Mortgage Type
New Conventional
Estimated Equity
$457,193
Purchase Details
Closed on
Dec 8, 2021
Sold by
Lynn Schwall Violet
Bought by
Schwall Violet L
Home Financials for this Owner
Home Financials are based on the most recent Mortgage that was taken out on this home.
Original Mortgage
$310,000
Outstanding Balance
$283,395
Interest Rate
3.12%
Mortgage Type
New Conventional
Estimated Equity
$457,193
Create a Home Valuation Report for This Property
The Home Valuation Report is an in-depth analysis detailing your home's value as well as a comparison with similar homes in the area
Home Values in the Area
Average Home Value in this Area
Purchase History
| Date | Buyer | Sale Price | Title Company |
|---|---|---|---|
| Schwall Violet Lynn | -- | -- | |
| Schwall Violet Lynn | -- | -- | |
| Schwall Violet L | -- | Stewart Title | |
| Schwall Violet L | -- | Stewart Title | |
| Schwall Violet L | -- | Stewart Title |
Source: Public Records
Mortgage History
| Date | Status | Borrower | Loan Amount |
|---|---|---|---|
| Open | Schwall Violet Lynn | $310,000 | |
| Closed | Schwall Violet Lynn | $310,000 | |
| Closed | Schwall Violet L | $310,000 |
Source: Public Records
Tax History
| Year | Tax Paid | Tax Assessment Tax Assessment Total Assessment is a certain percentage of the fair market value that is determined by local assessors to be the total taxable value of land and additions on the property. | Land | Improvement |
|---|---|---|---|---|
| 2025 | $2,874 | $274,752 | $138,675 | $136,077 |
| 2024 | $2,874 | $269,365 | $135,956 | $133,409 |
| 2023 | $2,750 | $264,085 | $133,291 | $130,794 |
| 2022 | $2,701 | $258,908 | $130,678 | $128,230 |
| 2021 | $2,683 | $253,832 | $128,116 | $125,716 |
| 2020 | $2,645 | $251,230 | $126,803 | $124,427 |
| 2019 | $2,594 | $246,305 | $124,317 | $121,988 |
| 2018 | $2,521 | $241,477 | $121,880 | $119,597 |
| 2017 | $2,475 | $236,743 | $119,491 | $117,252 |
| 2016 | $2,345 | $232,102 | $117,149 | $114,953 |
| 2015 | $2,299 | $228,617 | $115,390 | $113,227 |
| 2014 | $2,258 | $224,140 | $113,130 | $111,010 |
Source: Public Records
Map
Nearby Homes
- 12049 Blake Rd
- 0 Blake Rd
- 0 Alta Mesa Rd Unit 224117427
- 0 Colony Hill Ln
- 9777 Tavernor Rd
- #1 Alta Mesa Rd
- 0 Parcel D Unit 226001796
- 11529 Arno Rd
- 7770 Dillard Rd
- 9425 Montevideo Dr
- 0 Davis Rd Unit 226005785
- 11276 Randolph Rd
- 10600 Colony Rd
- 5-acres Hobday Rd
- 12800 Rimfire Dr
- 12501 Lee School Cross Rd
- 11213 Colony Rd
- 12542 Plum Ln
- 11343-2 Arno Rd
- 11343-4 Arno Rd
- 10106 Alta Mesa Rd
- 10134 Alta Mesa Rd
- 10124 Alta Mesa Rd
- 10111 Alta Mesa Rd
- 10088 Alta Mesa Rd
- 10139 Alta Mesa Rd
- 10078 Alta Mesa Rd
- 10089 Alta Mesa Rd
- 10141 La Clair Rd
- 12055 Blake Rd
- 10129 La Clair Rd
- 10058 Alta Mesa Rd
- 10073 Alta Mesa Rd
- 10125 La Clair Rd
- 10087 La Clair Rd
- 12170 Rising Rd
- 12147 Blake Rd
- 10065 La Clair Rd
- 12180 Rising Rd
- 10120 La Clair Rd
Your Personal Tour Guide
Ask me questions while you tour the home.