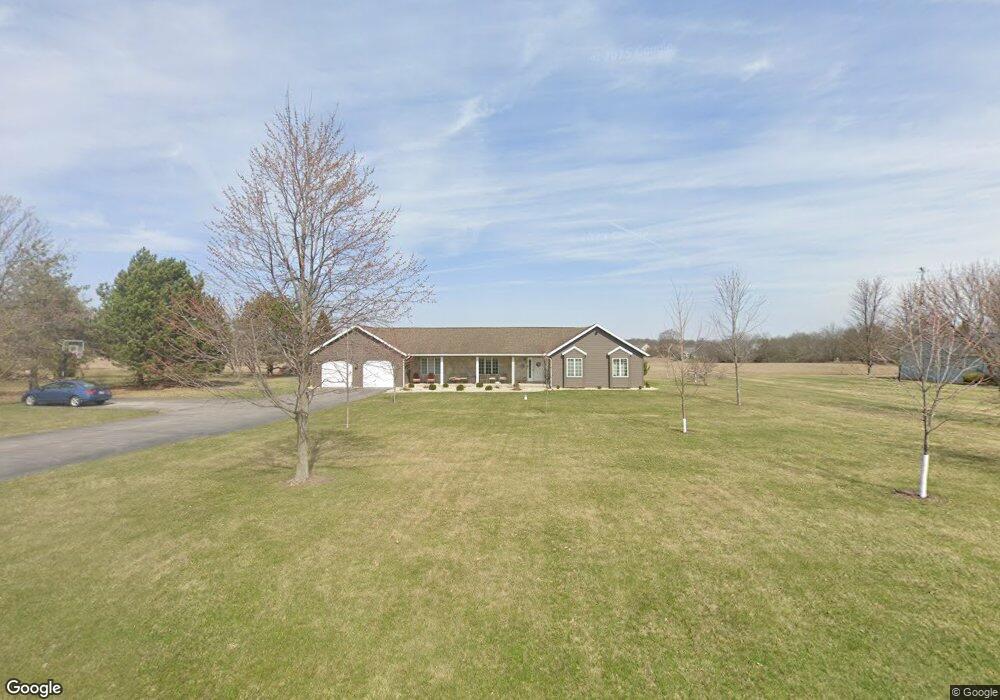
10115 Augsburger Rd Bluffton, OH 45817
Estimated Value: $294,000 - $391,000
4
Beds
3
Baths
2,199
Sq Ft
$161/Sq Ft
Est. Value
About This Home
This home is located at 10115 Augsburger Rd, Bluffton, OH 45817 and is currently estimated at $353,497, approximately $160 per square foot. 10115 Augsburger Rd is a home located in Allen County with nearby schools including Bluffton Elementary School, Bluffton Middle School, and Bluffton High School.
Ownership History
Date
Name
Owned For
Owner Type
Purchase Details
Closed on
Jul 13, 2006
Sold by
Refermay Mary Jo
Bought by
Kruse Ryan M and Kruse Kathryn M
Current Estimated Value
Home Financials for this Owner
Home Financials are based on the most recent Mortgage that was taken out on this home.
Original Mortgage
$170,000
Outstanding Balance
$104,756
Interest Rate
6.72%
Mortgage Type
FHA
Estimated Equity
$248,741
Purchase Details
Closed on
Mar 12, 2001
Sold by
Cottle Rose
Bought by
Refermat Mary Jo
Home Financials for this Owner
Home Financials are based on the most recent Mortgage that was taken out on this home.
Original Mortgage
$136,500
Interest Rate
7.18%
Mortgage Type
New Conventional
Purchase Details
Closed on
Jul 16, 1993
Sold by
Wineland Richard Jonathon
Bought by
Refermat Mary Jo
Purchase Details
Closed on
Jul 22, 1991
Bought by
Wineland Richard Jonathon
Create a Home Valuation Report for This Property
The Home Valuation Report is an in-depth analysis detailing your home's value as well as a comparison with similar homes in the area
Purchase History
| Date | Buyer | Sale Price | Title Company |
|---|---|---|---|
| Kruse Ryan M | $170,000 | None Available | |
| Refermat Mary Jo | $78,100 | -- | |
| Refermat Mary Jo | $145,000 | -- | |
| Wineland Richard Jonathon | $122,000 | -- |
Source: Public Records
Mortgage History
| Date | Status | Borrower | Loan Amount |
|---|---|---|---|
| Open | Kruse Ryan M | $170,000 | |
| Previous Owner | Refermat Mary Jo | $136,500 |
Source: Public Records
Tax History
| Year | Tax Paid | Tax Assessment Tax Assessment Total Assessment is a certain percentage of the fair market value that is determined by local assessors to be the total taxable value of land and additions on the property. | Land | Improvement |
|---|---|---|---|---|
| 2024 | $3,375 | $103,080 | $12,740 | $90,340 |
| 2023 | $2,697 | $75,810 | $9,380 | $66,430 |
| 2022 | $2,706 | $75,810 | $9,380 | $66,430 |
| 2021 | $2,727 | $75,810 | $9,380 | $66,430 |
| 2020 | $2,628 | $66,150 | $8,540 | $57,610 |
| 2019 | $2,628 | $66,150 | $8,540 | $57,610 |
| 2018 | $2,484 | $66,150 | $8,540 | $57,610 |
| 2017 | $2,253 | $56,560 | $8,540 | $48,020 |
| 2016 | $2,261 | $56,560 | $8,540 | $48,020 |
| 2015 | $2,296 | $56,560 | $8,540 | $48,020 |
| 2014 | $2,495 | $60,520 | $8,370 | $52,150 |
| 2013 | $2,312 | $60,520 | $8,370 | $52,150 |
Source: Public Records
Map
Nearby Homes
- 160 Chestnut Ln
- 0 Columbus Grove-Bluffton Rd
- 110 Magnolia Ln
- 307 Parkview Dr
- 513 S Jackson St
- 305 Parkview Dr
- 315 Parkview Dr
- 317 Parkview Dr
- 303 Parkview Dr
- 319 Parkview Dr
- 321 Parkview Dr
- 301 Parkview Dr
- 151 S Lawn Ave
- 327 Parkview Dr
- 218 S Jackson St
- 329 Parkview Dr
- 333 Parkview Dr
- 331 Parkview Dr
- 307 S Main St Unit back
- 222 N Lawn Ave
- 10077 Augsburger Rd
- 10145 Augsburger Rd
- 10043 Augsburger Rd
- 814 Red Maple Ct
- 10035 Augsburger Rd
- 802 Red Maple Ct
- 804 Red Maple Ct
- 805 Red Maple Ct
- 9979 Augsburger Rd
- 10942 Tom Fett Rd
- 10908 Tom Fett Rd
- 300 Riverbend Dr
- 220 Riverbend Dr
- TBD Riverbend Dr
- 000 Riverbend Dr
- 31 Riverbend Dr
- 30 Riverbend Dr
- 29 Riverbend Dr
- 24 Riverbend Dr
- 310 Riverbend Dr
Your Personal Tour Guide
Ask me questions while you tour the home.