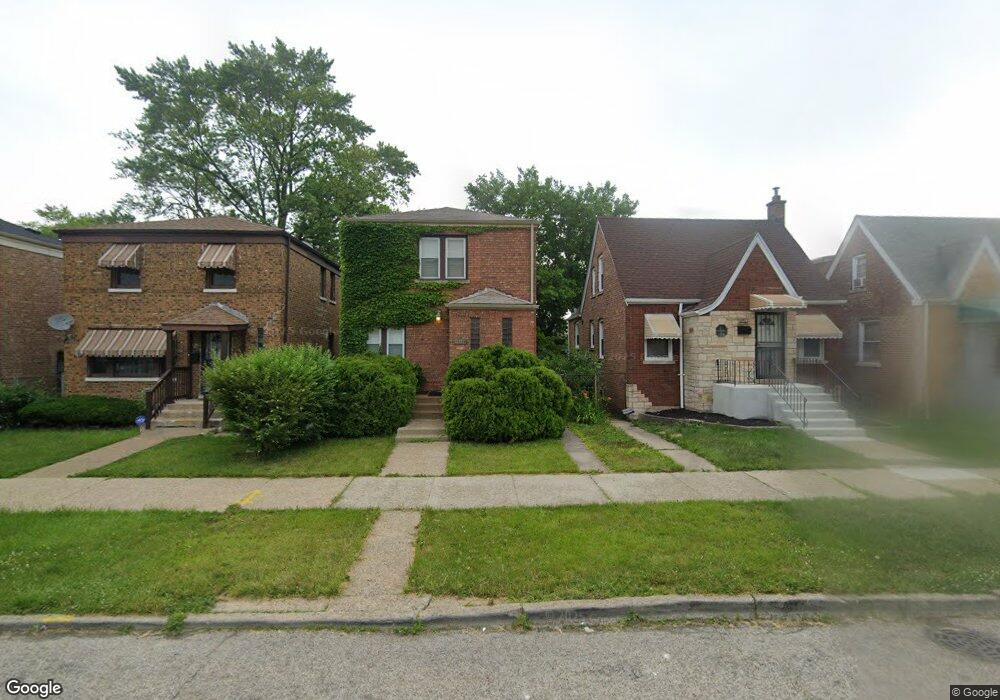
10115 S Forest Ave Chicago, IL 60628
Roseland NeighborhoodEstimated Value: $156,000 - $205,419
3
Beds
2
Baths
1,072
Sq Ft
$172/Sq Ft
Est. Value
About This Home
This home is located at 10115 S Forest Ave, Chicago, IL 60628 and is currently estimated at $184,605, approximately $172 per square foot. 10115 S Forest Ave is a home located in Cook County with nearby schools including Bennett Elementary School, Harlan Community Academy High School, and St. John de la Salle School.
Ownership History
Date
Name
Owned For
Owner Type
Purchase Details
Closed on
Aug 31, 2005
Sold by
Muhammad Malcolm C and Muhammaed Kasey C
Bought by
Hill Sheronne C
Current Estimated Value
Home Financials for this Owner
Home Financials are based on the most recent Mortgage that was taken out on this home.
Original Mortgage
$124,000
Outstanding Balance
$67,006
Interest Rate
6.01%
Mortgage Type
Fannie Mae Freddie Mac
Estimated Equity
$117,599
Purchase Details
Closed on
Jan 7, 1997
Sold by
Southwest Financial Bank & Trust Company
Bought by
Parish Malcolm and Parish Kasey
Home Financials for this Owner
Home Financials are based on the most recent Mortgage that was taken out on this home.
Original Mortgage
$85,260
Interest Rate
7.54%
Purchase Details
Closed on
Aug 14, 1996
Sold by
Adamson John P
Bought by
Southwest Financial Bank & Trust Company
Purchase Details
Closed on
Jul 30, 1996
Sold by
Citicorp Mtg Inc
Bought by
Adamson John P
Create a Home Valuation Report for This Property
The Home Valuation Report is an in-depth analysis detailing your home's value as well as a comparison with similar homes in the area
Home Values in the Area
Average Home Value in this Area
Purchase History
| Date | Buyer | Sale Price | Title Company |
|---|---|---|---|
| Hill Sheronne C | $155,000 | Ticor Title Insurance | |
| Parish Malcolm | $88,000 | -- | |
| Southwest Financial Bank & Trust Company | -- | -- | |
| Adamson John P | $52,000 | -- |
Source: Public Records
Mortgage History
| Date | Status | Borrower | Loan Amount |
|---|---|---|---|
| Open | Hill Sheronne C | $124,000 | |
| Previous Owner | Parish Malcolm | $85,260 |
Source: Public Records
Tax History Compared to Growth
Tax History
| Year | Tax Paid | Tax Assessment Tax Assessment Total Assessment is a certain percentage of the fair market value that is determined by local assessors to be the total taxable value of land and additions on the property. | Land | Improvement |
|---|---|---|---|---|
| 2024 | $2,048 | $13,801 | $5,498 | $8,303 |
| 2023 | $1,976 | $13,000 | $4,875 | $8,125 |
| 2022 | $1,976 | $13,000 | $4,875 | $8,125 |
| 2021 | $1,950 | $13,000 | $4,875 | $8,125 |
| 2020 | $1,771 | $11,031 | $3,000 | $8,031 |
| 2019 | $1,778 | $12,257 | $3,000 | $9,257 |
| 2018 | $1,747 | $12,257 | $3,000 | $9,257 |
| 2017 | $1,604 | $10,808 | $2,625 | $8,183 |
| 2016 | $1,669 | $10,808 | $2,625 | $8,183 |
| 2015 | $1,504 | $10,808 | $2,625 | $8,183 |
| 2014 | $1,405 | $10,122 | $2,250 | $7,872 |
| 2013 | $1,366 | $10,122 | $2,250 | $7,872 |
Source: Public Records
Map
Nearby Homes
- 10123 S Forest Ave
- 10152 S Calumet Ave
- 10047 S Calumet Ave
- 10229 S Calumet Ave
- 10231 S Prairie Ave
- 10106 S Vernon Ave
- 10056 S Indiana Ave
- 10046 S Indiana Ave
- 10040 S Vernon Ave
- 10238 S Vernon Ave
- 10246 S Vernon Ave
- 10327 S Calumet Ave
- 10339 S Calumet Ave
- 64 E 102nd Place
- 10346 S King Dr
- 70 E 100th Place
- 9912 S Prairie Ave
- 10324 S Eberhart Ave
- 30 E 102nd St
- 41 E 102nd Place
- 10117 S Forest Ave
- 10111 S Forest Ave
- 10119 S Forest Ave
- 10107 S Forest Ave
- 10105 S Forest Ave
- 10125 S Forest Ave
- 10101 S Forest Ave
- 10112 S Calumet Ave
- 10116 S Calumet Ave
- 10110 S Calumet Ave
- 10129 S Forest Ave
- 10118 S Calumet Ave
- 10122 S Calumet Ave
- 10106 S Calumet Ave
- 10131 S Forest Ave
- 10124 S Calumet Ave
- 10100 S Calumet Ave
- 10128 S Calumet Ave
- 10059 S Forest Ave
- 10130 S Calumet Ave