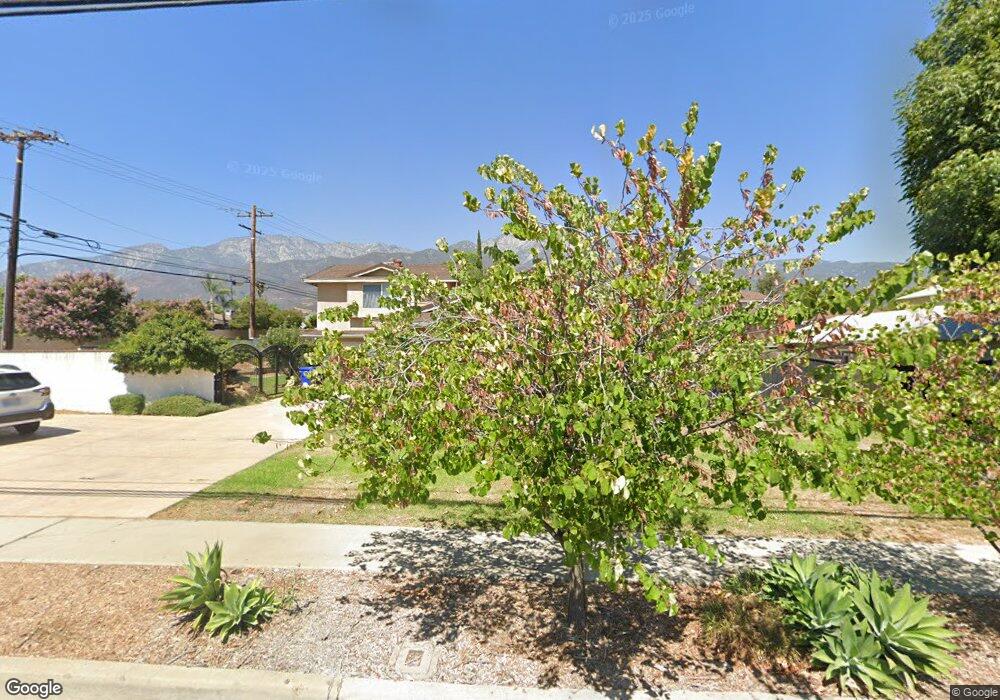
10116 Lemon Ave Rancho Cucamonga, CA 91737
Estimated Value: $709,373 - $918,000
4
Beds
2
Baths
1,750
Sq Ft
$452/Sq Ft
Est. Value
About This Home
This home is located at 10116 Lemon Ave, Rancho Cucamonga, CA 91737 and is currently estimated at $790,343, approximately $451 per square foot. 10116 Lemon Ave is a home located in San Bernardino County with nearby schools including Hermosa Elementary, Vineyard Junior High, and Los Osos High.
Ownership History
Date
Name
Owned For
Owner Type
Purchase Details
Closed on
Aug 9, 2005
Sold by
Jamily Mojib
Bought by
Cross Jeffrey E
Current Estimated Value
Purchase Details
Closed on
Sep 2, 1994
Sold by
Holmes Mark V
Bought by
Blunk Michael Scott and Blunk Laurie Shuman
Home Financials for this Owner
Home Financials are based on the most recent Mortgage that was taken out on this home.
Original Mortgage
$127,862
Interest Rate
8.37%
Mortgage Type
FHA
Create a Home Valuation Report for This Property
The Home Valuation Report is an in-depth analysis detailing your home's value as well as a comparison with similar homes in the area
Home Values in the Area
Average Home Value in this Area
Purchase History
| Date | Buyer | Sale Price | Title Company |
|---|---|---|---|
| Cross Jeffrey E | $450,000 | Fidelity National Title Co | |
| Blunk Michael Scott | $121,000 | Chicago Title Co |
Source: Public Records
Mortgage History
| Date | Status | Borrower | Loan Amount |
|---|---|---|---|
| Previous Owner | Blunk Michael Scott | $127,862 |
Source: Public Records
Tax History Compared to Growth
Tax History
| Year | Tax Paid | Tax Assessment Tax Assessment Total Assessment is a certain percentage of the fair market value that is determined by local assessors to be the total taxable value of land and additions on the property. | Land | Improvement |
|---|---|---|---|---|
| 2025 | $2,301 | $216,681 | $53,749 | $162,932 |
| 2024 | $2,301 | $212,432 | $52,695 | $159,737 |
| 2023 | $2,248 | $208,267 | $51,662 | $156,605 |
| 2022 | $2,241 | $204,183 | $50,649 | $153,534 |
| 2021 | $2,239 | $200,180 | $49,656 | $150,524 |
| 2020 | $2,147 | $198,128 | $49,147 | $148,981 |
| 2019 | $2,170 | $194,243 | $48,183 | $146,060 |
| 2018 | $2,120 | $190,434 | $47,238 | $143,196 |
| 2017 | $2,023 | $186,700 | $46,312 | $140,388 |
| 2016 | $1,967 | $183,039 | $45,404 | $137,635 |
| 2015 | $1,954 | $180,290 | $44,722 | $135,568 |
| 2014 | $1,897 | $176,758 | $43,846 | $132,912 |
Source: Public Records
Map
Nearby Homes
- 10655 401 Lemon Ave Unit 401
- 10141 Orange St
- 6281 Kinlock Ave
- 6162 Mayberry Ave
- 10330 Orange St
- 6360 Daylily Ct
- 10393 Cartilla Ct
- 10123 Finch Ave
- 9855 Banyan St
- 6600 Montresor Place
- 6644 Brissac Place
- 9757 Balaton St
- 9979 Timbermist Ct
- 5885 Zapata Place
- 6258 Callaway Place
- 6155 Klusman Ave
- 10655 Lemon Ave Unit 2605
- 10655 Lemon Ave Unit 3613
- 10655 Lemon Ave Unit 3808
- 10655 Lemon Ave Unit 4004
- 10126 Lemon Ave
- 6280 Filkins Ave
- 6290 Filkins Ave
- 10124 Orange St
- 10086 Lemon Ave
- 6270 Filkins Ave
- 10130 Orange St
- 10120 Orange St
- 10071 Kingston St
- 6291 Filkins Ave
- 10140 Orange St
- 6281 Filkins Ave
- 6255 Granby Ave
- 6260 Filkins Ave
- 10074 Lemon Ave
- 6325 Granby Ave
- 6271 Filkins Ave
- 6250 Filkins Ave
- 10150 Orange St
- 10068 Orange St