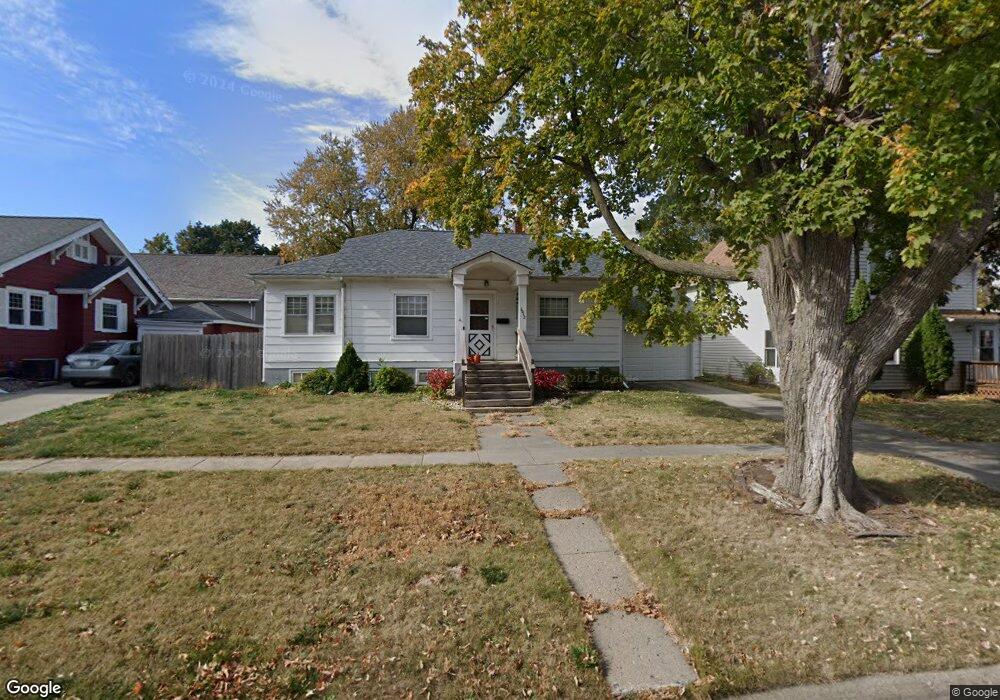
1012 10th St Nevada, IA 50201
Estimated Value: $150,000 - $165,000
2
Beds
1
Bath
996
Sq Ft
$158/Sq Ft
Est. Value
About This Home
This home is located at 1012 10th St, Nevada, IA 50201 and is currently estimated at $157,302, approximately $157 per square foot. 1012 10th St is a home located in Story County with nearby schools including Central Elementary School, Nevada Middle School, and Nevada High School.
Ownership History
Date
Name
Owned For
Owner Type
Purchase Details
Closed on
Apr 21, 2017
Sold by
Vanvansickle Bre Van
Bought by
Mills Brandon
Current Estimated Value
Home Financials for this Owner
Home Financials are based on the most recent Mortgage that was taken out on this home.
Original Mortgage
$97,979
Outstanding Balance
$81,578
Interest Rate
4.23%
Mortgage Type
New Conventional
Estimated Equity
$75,724
Purchase Details
Closed on
Sep 16, 2014
Sold by
Vansickle William J and Vansickle Jean
Bought by
Vansickle Bre
Create a Home Valuation Report for This Property
The Home Valuation Report is an in-depth analysis detailing your home's value as well as a comparison with similar homes in the area
Home Values in the Area
Average Home Value in this Area
Purchase History
| Date | Buyer | Sale Price | Title Company |
|---|---|---|---|
| Mills Brandon | $97,000 | None Available | |
| Vansickle Bre | -- | None Available |
Source: Public Records
Mortgage History
| Date | Status | Borrower | Loan Amount |
|---|---|---|---|
| Open | Mills Brandon | $97,979 |
Source: Public Records
Tax History Compared to Growth
Tax History
| Year | Tax Paid | Tax Assessment Tax Assessment Total Assessment is a certain percentage of the fair market value that is determined by local assessors to be the total taxable value of land and additions on the property. | Land | Improvement |
|---|---|---|---|---|
| 2025 | $1,924 | $119,800 | $28,200 | $91,600 |
| 2024 | $1,878 | $116,000 | $28,200 | $87,800 |
| 2023 | $1,910 | $116,000 | $28,200 | $87,800 |
| 2022 | $1,718 | $97,100 | $28,200 | $68,900 |
| 2021 | $1,732 | $97,100 | $28,200 | $68,900 |
| 2020 | $1,678 | $92,400 | $27,100 | $65,300 |
| 2019 | $1,678 | $92,400 | $27,100 | $65,300 |
| 2018 | $1,706 | $88,100 | $27,100 | $61,000 |
| 2017 | $1,706 | $88,100 | $27,100 | $61,000 |
| 2016 | $1,550 | $81,100 | $21,700 | $59,400 |
| 2015 | $1,550 | $81,100 | $21,700 | $59,400 |
| 2014 | $1,674 | $77,100 | $21,700 | $55,400 |
Source: Public Records
Map
Nearby Homes