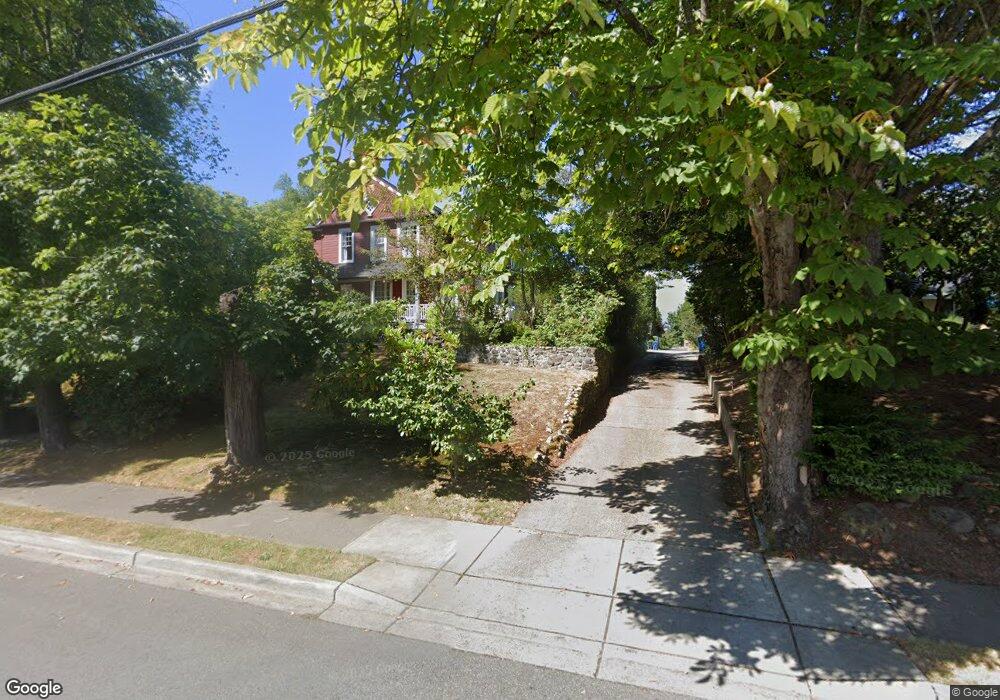
1012 4th St Unit 98290 Snohomish, WA 98290
Estimated Value: $2,024,000 - $2,167,626
6
Beds
6
Baths
13,990
Sq Ft
$150/Sq Ft
Est. Value
About This Home
This home is located at 1012 4th St Unit 98290, Snohomish, WA 98290 and is currently estimated at $2,099,907, approximately $150 per square foot. 1012 4th St Unit 98290 is a home located in Snohomish County with nearby schools including Central Emerson Elementary School, Centennial Middle School, and Snohomish High School.
Ownership History
Date
Name
Owned For
Owner Type
Purchase Details
Closed on
Oct 4, 2022
Sold by
Adams Elizabeth
Bought by
Krabach Brian and Krabach Charlcia
Current Estimated Value
Home Financials for this Owner
Home Financials are based on the most recent Mortgage that was taken out on this home.
Original Mortgage
$1,699,999
Outstanding Balance
$1,634,178
Interest Rate
5.89%
Mortgage Type
New Conventional
Estimated Equity
$465,729
Purchase Details
Closed on
Feb 6, 2013
Sold by
Myrfors Jesper
Bought by
Adams Elizabeth
Purchase Details
Closed on
Oct 11, 1995
Sold by
Field Duane C and Field Billie M
Bought by
Myrfors Jesper
Home Financials for this Owner
Home Financials are based on the most recent Mortgage that was taken out on this home.
Original Mortgage
$341,950
Interest Rate
6.87%
Create a Home Valuation Report for This Property
The Home Valuation Report is an in-depth analysis detailing your home's value as well as a comparison with similar homes in the area
Home Values in the Area
Average Home Value in this Area
Purchase History
| Date | Buyer | Sale Price | Title Company |
|---|---|---|---|
| Krabach Brian | -- | Commonwealth Land Title | |
| Adams Elizabeth | $550,000 | Rainier Title | |
| Myrfors Jesper | $359,950 | Charter Title |
Source: Public Records
Mortgage History
| Date | Status | Borrower | Loan Amount |
|---|---|---|---|
| Open | Krabach Brian | $1,699,999 | |
| Previous Owner | Myrfors Jesper | $341,950 |
Source: Public Records
Tax History Compared to Growth
Tax History
| Year | Tax Paid | Tax Assessment Tax Assessment Total Assessment is a certain percentage of the fair market value that is determined by local assessors to be the total taxable value of land and additions on the property. | Land | Improvement |
|---|---|---|---|---|
| 2025 | $15,296 | $1,676,900 | $470,300 | $1,206,600 |
| 2024 | $15,296 | $1,573,900 | $437,000 | $1,136,900 |
| 2023 | $15,196 | $1,733,600 | $470,400 | $1,263,200 |
| 2022 | $15,826 | $1,467,200 | $394,300 | $1,072,900 |
| 2020 | $14,465 | $1,246,500 | $310,200 | $936,300 |
| 2019 | $13,671 | $1,202,300 | $286,700 | $915,600 |
| 2018 | $14,335 | $1,055,400 | $235,000 | $820,400 |
| 2017 | $13,144 | $986,300 | $230,300 | $756,000 |
| 2016 | $6,630 | $482,100 | $251,000 | $231,100 |
| 2015 | $6,419 | $446,900 | $153,900 | $293,000 |
| 2013 | $10,118 | $684,300 | $117,000 | $567,300 |
Source: Public Records
Map
Nearby Homes
- 307 Avenue C
- 322 Avenue D
- 312 Avenue D
- 612 5th St
- 620 Avenue B Unit 9
- 302 Avenue E
- 417 Avenue F Unit C
- 431 Avenue F
- 1412 2nd St
- 401 Pine Ave
- 400 6th St
- 57 Maple Ave
- 723 Ford Ave
- 1101 10th St Unit 31
- 521 Cypress Ave
- 527 Cypress Ave
- 9624 Lowell Snohomish River Rd
- 325 J Ave Unit B
- 325 J Ave Unit A
- 165 Cypress Ave