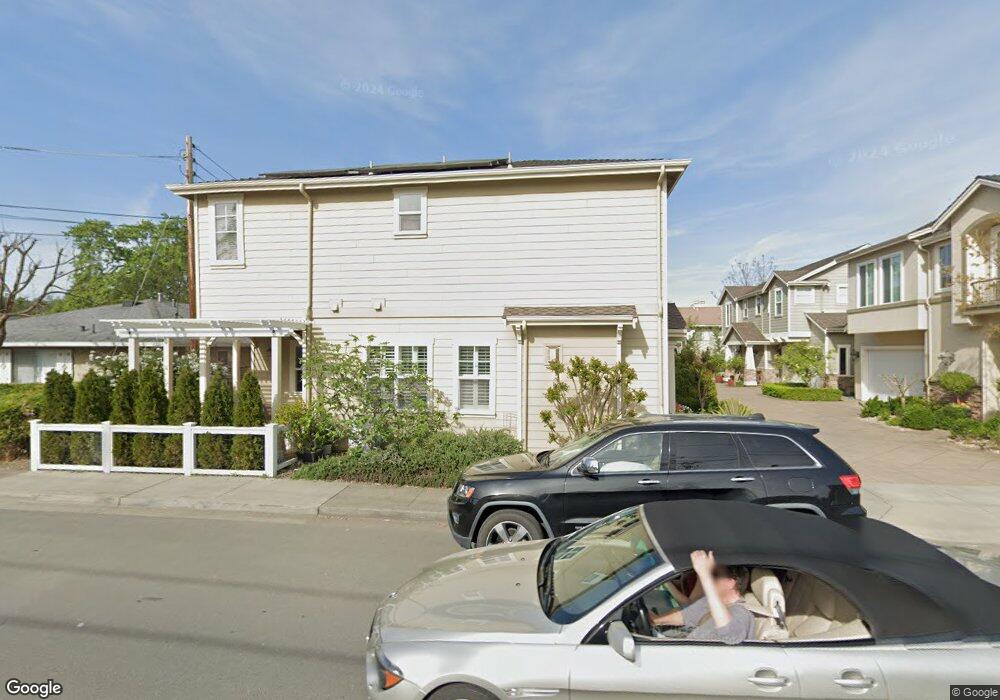
1012 Allison Ave Saint Helena, CA 94574
Estimated Value: $1,018,041 - $1,357,000
3
Beds
3
Baths
1,618
Sq Ft
$709/Sq Ft
Est. Value
About This Home
This home is located at 1012 Allison Ave, Saint Helena, CA 94574 and is currently estimated at $1,147,260, approximately $709 per square foot. 1012 Allison Ave is a home located in Napa County with nearby schools including Saint Helena Elementary School, Saint Helena Primary School, and Robert Louis Stevenson Intermediate School.
Ownership History
Date
Name
Owned For
Owner Type
Purchase Details
Closed on
Oct 28, 2008
Sold by
Vintners Court Llc
Bought by
Acevedo Gonzalo A and Acevedo Veronica
Current Estimated Value
Home Financials for this Owner
Home Financials are based on the most recent Mortgage that was taken out on this home.
Original Mortgage
$403,913
Outstanding Balance
$259,936
Interest Rate
5.77%
Mortgage Type
FHA
Estimated Equity
$887,324
Purchase Details
Closed on
Sep 11, 2007
Sold by
Sherwin Steve and Sherwin Linda
Bought by
Vintners Court Llc
Purchase Details
Closed on
Jun 13, 2002
Sold by
Kecskeymethy Ilona J and Estate Of Irene Z Kecskeymethy
Bought by
Sherwin Steve and Sherwin Linda
Purchase Details
Closed on
Jun 2, 2001
Sold by
Kecskemethy Ilona Judith and Kecskemethy Irene
Bought by
Kecskemethy Ilona Judith and Kecskemethy Irene
Create a Home Valuation Report for This Property
The Home Valuation Report is an in-depth analysis detailing your home's value as well as a comparison with similar homes in the area
Home Values in the Area
Average Home Value in this Area
Purchase History
| Date | Buyer | Sale Price | Title Company |
|---|---|---|---|
| Acevedo Gonzalo A | $409,500 | Fidelity National Title Co | |
| Vintners Court Llc | -- | None Available | |
| Sherwin Steve | $400,000 | First American Title Co | |
| Kecskemethy Ilona Judith | -- | -- |
Source: Public Records
Mortgage History
| Date | Status | Borrower | Loan Amount |
|---|---|---|---|
| Open | Acevedo Gonzalo A | $403,913 |
Source: Public Records
Tax History
| Year | Tax Paid | Tax Assessment Tax Assessment Total Assessment is a certain percentage of the fair market value that is determined by local assessors to be the total taxable value of land and additions on the property. | Land | Improvement |
|---|---|---|---|---|
| 2025 | $5,592 | $527,324 | $193,157 | $334,167 |
| 2024 | $5,481 | $516,985 | $189,370 | $327,615 |
| 2023 | $5,481 | $506,849 | $185,657 | $321,192 |
| 2022 | $5,205 | $496,912 | $182,017 | $314,895 |
| 2021 | $5,133 | $487,170 | $178,449 | $308,721 |
| 2020 | $5,080 | $482,176 | $176,620 | $305,556 |
| 2019 | $4,990 | $472,722 | $173,157 | $299,565 |
| 2018 | $4,909 | $463,454 | $169,762 | $293,692 |
| 2017 | $4,815 | $454,368 | $166,434 | $287,934 |
| 2016 | $4,702 | $445,460 | $163,171 | $282,289 |
| 2015 | $4,665 | $438,770 | $160,721 | $278,049 |
| 2014 | $4,619 | $430,176 | $157,573 | $272,603 |
Source: Public Records
Map
Nearby Homes
- 945 Brown St
- 760 Granada Ct
- 1017 Charter Oak Ave
- 844 Signorelli Cir
- 921 Chiles Ave
- 806 Chiles Ave
- 1123 Oak Ave
- 1133 Oak Ave
- 1328 Monte Vista Ave
- 14 San Lucas Ct
- 1356 Monte Vista Ave
- 7 San Juan Ct
- 2 La Cuesta Ct
- 7 Del Campo Ct
- 1503 Tainter St
- 1551 Spring St
- 1530 Voorhees Cir
- 56 Laguna Seca Ct
- 1209 Stockton St
- 1243 Stockton St
- 1014 Allison Ave
- 990 Allison Ave
- 980 Allison Ave
- 974 Allison Ave
- 943 Mariposa Ln
- 947 Mariposa Ln
- 945 Mariposa Ln Unit 33
- 941 Mariposa Ln
- 1018 Allison Ave
- 933 Mariposa Ln Unit 35
- 936 Allison Ave
- 1021 Allison Ave
- 931 Mariposa Ln
- 1015 Allison Ave
- 1025 Allison Ave
- 821 Pope St
- 951 Mariposa Ln
- 935 Allison Ave
- 910 Brown St
- 930 Allison Ave
Your Personal Tour Guide
Ask me questions while you tour the home.