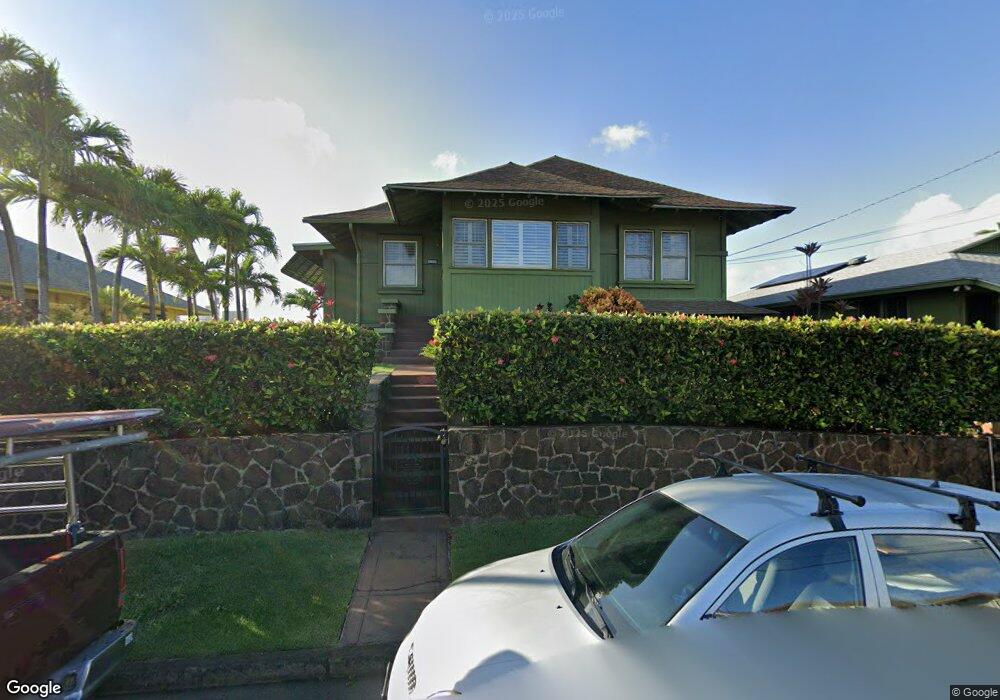
1012 Belser St Honolulu, HI 96816
Diamond Head-Kapahula-Saint Louis NeighborhoodEstimated Value: $1,121,812 - $1,704,000
2
Beds
1
Bath
1,346
Sq Ft
$1,035/Sq Ft
Est. Value
About This Home
This home is located at 1012 Belser St, Honolulu, HI 96816 and is currently estimated at $1,393,453, approximately $1,035 per square foot. 1012 Belser St is a home located in Honolulu County with nearby schools including Prince Jonah Kuhio Elementary School, President George Washington Middle School, and Kaimuki High School.
Ownership History
Date
Name
Owned For
Owner Type
Purchase Details
Closed on
Jun 24, 2014
Sold by
Chun Herman Bing Wah and Chun Joyce Hung Ngun
Bought by
Herman & Joyce Chun Revocable Trust and Chun Joyce H N
Current Estimated Value
Purchase Details
Closed on
Aug 15, 2006
Sold by
Ching Shirley T and Ching Shirley Tom
Bought by
Ching Shirley Tom and Shirley Tom Ching Revocable Trust
Purchase Details
Closed on
Oct 28, 2005
Sold by
Chun Herman B W and Chun Joyce H N
Bought by
Mau Evelyn C and Ching Shirley T
Purchase Details
Closed on
Oct 17, 2005
Sold by
Chun Henry B C
Bought by
Mau Evelyn C and Ching Shirley T
Purchase Details
Closed on
Aug 25, 2004
Sold by
Kwock Gerald W G
Bought by
Chun Herman Bing Wah and Herman B W Chun Revocable Living Trust
Purchase Details
Closed on
Jun 3, 1997
Sold by
Kwock Gerald Wah Gee
Bought by
Kwock Gerald W G and Revocable Trust Of Gerald W G Kwock
Create a Home Valuation Report for This Property
The Home Valuation Report is an in-depth analysis detailing your home's value as well as a comparison with similar homes in the area
Home Values in the Area
Average Home Value in this Area
Purchase History
| Date | Buyer | Sale Price | Title Company |
|---|---|---|---|
| Herman & Joyce Chun Revocable Trust | -- | None Available | |
| Chun Herman Bing Wah | -- | None Available | |
| Herman & Joyce Chun Revocable Trust | -- | None Available | |
| Chun Herman Bing Wah | -- | None Available | |
| Ching Shirley Tom | -- | None Available | |
| Mau Evelyn C | -- | -- | |
| Mau Evelyn C | -- | -- | |
| Chun Herman Bing Wah | $1,000 | Itc | |
| Kwock Gerald W G | -- | -- |
Source: Public Records
Tax History Compared to Growth
Tax History
| Year | Tax Paid | Tax Assessment Tax Assessment Total Assessment is a certain percentage of the fair market value that is determined by local assessors to be the total taxable value of land and additions on the property. | Land | Improvement |
|---|---|---|---|---|
| 2025 | $3,305 | $1,117,600 | $975,000 | $142,600 |
| 2024 | $3,305 | $1,104,400 | $950,600 | $153,800 |
| 2023 | $2,987 | $1,093,500 | $950,600 | $142,900 |
| 2022 | $3,394 | $1,109,800 | $853,100 | $256,700 |
| 2021 | $2,997 | $996,200 | $760,000 | $236,200 |
| 2020 | $2,417 | $830,500 | $741,000 | $89,500 |
| 2019 | $2,537 | $844,800 | $731,500 | $113,300 |
| 2018 | $2,545 | $847,200 | $703,000 | $144,200 |
| 2017 | $2,031 | $700,200 | $655,500 | $44,700 |
| 2016 | $1,985 | $687,200 | $655,500 | $31,700 |
| 2015 | $2,115 | $724,300 | $617,500 | $106,800 |
| 2014 | $1,755 | $668,800 | $579,500 | $89,300 |
Source: Public Records
Map
Nearby Homes
- 1017 2nd Ave
- 1005 Belser St
- 1001 Belser St
- 922 Kapahulu Ave Unit 207
- 922 Kapahulu Ave Unit 302
- 2904 Kaimuki Ave
- 910 Kapahulu Ave Unit 807
- 910 Kapahulu Ave Unit 303
- 910 Kapahulu Ave Unit 607
- 1148 2nd Ave
- 3142 Olu St
- 888 4th Ave
- 1122 4th Ave Unit A
- 3152 Mokihana St
- 3110 Waialae Ave
- 3266 Kaimuki Ave
- 3138 Waialae Ave Unit 916
- 3138 Waialae Ave Unit 632
- 3138 Waialae Ave Unit 136
- 3138 Waialae Ave Unit 510
- 1020 Belser St
- 1004 Belser St
- 1009 2nd Ave
- 1009 2nd Ave Unit 3
- 1009 2nd Ave Unit 1
- 3104 Lincoln Ave
- 1013 2nd Ave
- 1022 Belser St
- 1011 Belser St
- 1015 Belser St
- 3122 Lincoln Ave
- 1021 Belser St
- 3111 Lincoln Ave
- 1025 2nd Ave
- 3115 Lincoln Ave
- 3107 Lincoln Ave Unit 703
- 3101 Lincoln Ave
- 1010 2nd Ave
- 950 3rd Ave
- 1002 3rd Ave