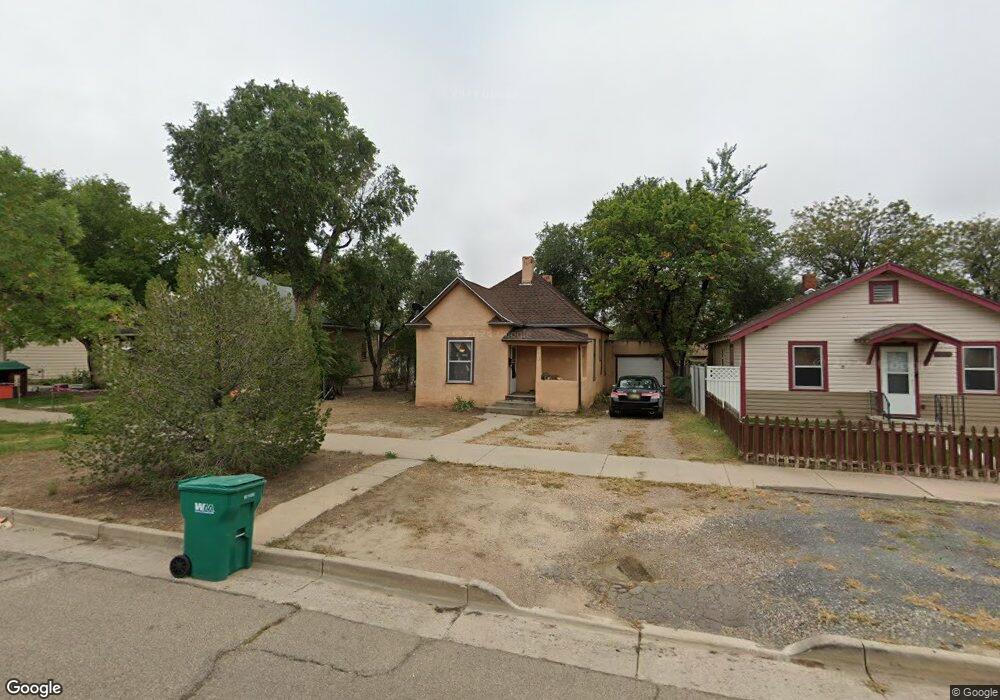
1012 E 7th St Pueblo, CO 81001
East Side NeighborhoodEstimated Value: $114,000 - $122,000
2
Beds
1
Bath
776
Sq Ft
$153/Sq Ft
Est. Value
About This Home
This home is located at 1012 E 7th St, Pueblo, CO 81001 and is currently estimated at $118,877, approximately $153 per square foot. 1012 E 7th St is a home located in Pueblo County with nearby schools including Park View Elementary School, Risley International Academy of Innovation, and Centennial High School.
Ownership History
Date
Name
Owned For
Owner Type
Purchase Details
Closed on
May 30, 2007
Sold by
Herrera Claudine and Herrera Harold J
Bought by
Dbd Properties Llc
Current Estimated Value
Home Financials for this Owner
Home Financials are based on the most recent Mortgage that was taken out on this home.
Original Mortgage
$40,233
Outstanding Balance
$24,592
Interest Rate
6.17%
Mortgage Type
Seller Take Back
Estimated Equity
$94,285
Purchase Details
Closed on
Oct 11, 2005
Sold by
Herrera Claudine
Bought by
Herrera Claudine and Herrera Harold J
Purchase Details
Closed on
Oct 6, 2003
Sold by
Aragon
Bought by
Herrera Claudine
Purchase Details
Closed on
Oct 30, 1987
Bought by
Aragon Erneest L + Helen B
Purchase Details
Closed on
Oct 22, 1987
Bought by
Aragon Ernest L + Helen B
Create a Home Valuation Report for This Property
The Home Valuation Report is an in-depth analysis detailing your home's value as well as a comparison with similar homes in the area
Home Values in the Area
Average Home Value in this Area
Purchase History
| Date | Buyer | Sale Price | Title Company |
|---|---|---|---|
| Dbd Properties Llc | $45,000 | Stg | |
| Herrera Claudine | -- | Security Title | |
| Herrera Claudine | -- | -- | |
| Aragon Erneest L + Helen B | -- | -- | |
| Aragon Ernest L + Helen B | $7,500 | -- |
Source: Public Records
Mortgage History
| Date | Status | Borrower | Loan Amount |
|---|---|---|---|
| Open | Dbd Properties Llc | $40,233 |
Source: Public Records
Tax History
| Year | Tax Paid | Tax Assessment Tax Assessment Total Assessment is a certain percentage of the fair market value that is determined by local assessors to be the total taxable value of land and additions on the property. | Land | Improvement |
|---|---|---|---|---|
| 2024 | $455 | $4,590 | -- | -- |
| 2023 | $461 | $8,280 | $1,010 | $7,270 |
| 2022 | $569 | $5,730 | $400 | $5,330 |
| 2021 | $586 | $5,890 | $410 | $5,480 |
| 2020 | $342 | $5,500 | $410 | $5,090 |
| 2019 | $342 | $3,390 | $286 | $3,104 |
| 2018 | $227 | $2,510 | $288 | $2,222 |
| 2017 | $230 | $2,510 | $288 | $2,222 |
| 2016 | $219 | $2,412 | $318 | $2,094 |
| 2015 | $218 | $2,412 | $318 | $2,094 |
| 2014 | $236 | $2,605 | $318 | $2,287 |
Source: Public Records
Map
Nearby Homes
Your Personal Tour Guide
Ask me questions while you tour the home.