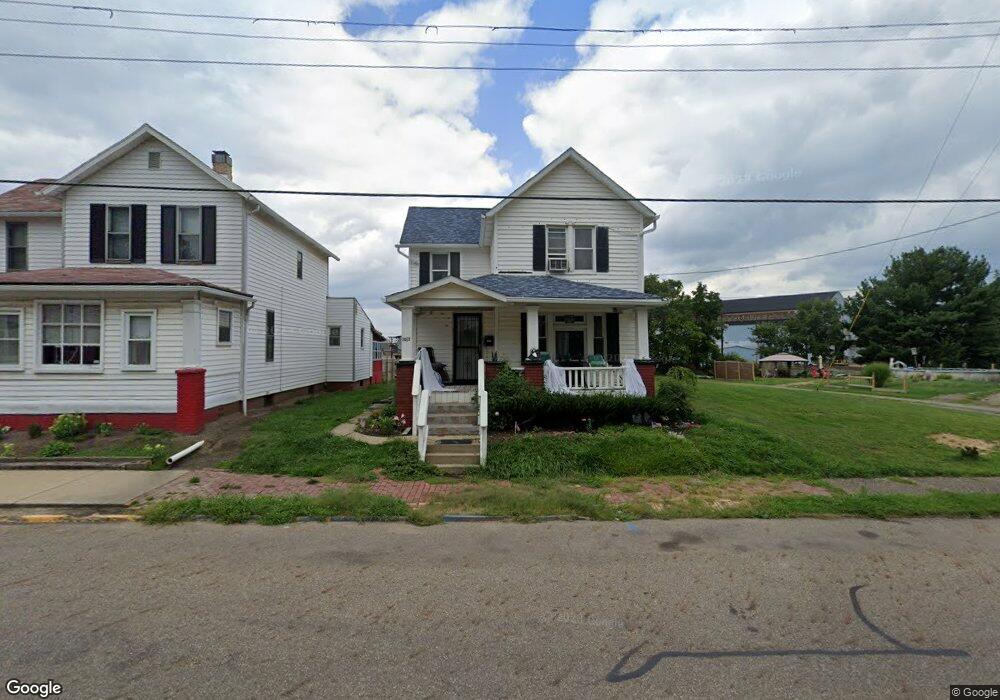
1012 E Summit St Alliance, OH 44601
Estimated Value: $115,000 - $130,000
4
Beds
1
Bath
1,496
Sq Ft
$83/Sq Ft
Est. Value
About This Home
This home is located at 1012 E Summit St, Alliance, OH 44601 and is currently estimated at $123,629, approximately $82 per square foot. 1012 E Summit St is a home located in Stark County with nearby schools including Alliance Intermediate School at Northside, Alliance Elementary School at Rockhill, and Alliance Middle School.
Ownership History
Date
Name
Owned For
Owner Type
Purchase Details
Closed on
Apr 11, 2024
Sold by
Arlette 1973 Trust and Allen Saprina
Bought by
Flugan Rockne and Flugan Brittany
Current Estimated Value
Home Financials for this Owner
Home Financials are based on the most recent Mortgage that was taken out on this home.
Original Mortgage
$6,400
Outstanding Balance
$6,342
Interest Rate
9.4%
Estimated Equity
$117,287
Purchase Details
Closed on
Jul 10, 2020
Sold by
Mba Nv Llc
Bought by
Allen Saprina and The Arlett 1973 Trust
Purchase Details
Closed on
Jun 19, 2020
Sold by
Jones Margaret P and Jones Margaret
Bought by
Mba Nv Llc
Purchase Details
Closed on
Jul 14, 2016
Sold by
King Margo
Bought by
Jones Margaret
Create a Home Valuation Report for This Property
The Home Valuation Report is an in-depth analysis detailing your home's value as well as a comparison with similar homes in the area
Home Values in the Area
Average Home Value in this Area
Purchase History
| Date | Buyer | Sale Price | Title Company |
|---|---|---|---|
| Flugan Rockne | $128,000 | Heritage Union Title | |
| Allen Saprina | $42,300 | None Available | |
| Mba Nv Llc | $42,500 | None Available | |
| Jones Margaret | -- | None Available |
Source: Public Records
Mortgage History
| Date | Status | Borrower | Loan Amount |
|---|---|---|---|
| Open | Flugan Rockne | $6,400 | |
| Open | Flugan Rockne | $125,681 |
Source: Public Records
Tax History
| Year | Tax Paid | Tax Assessment Tax Assessment Total Assessment is a certain percentage of the fair market value that is determined by local assessors to be the total taxable value of land and additions on the property. | Land | Improvement |
|---|---|---|---|---|
| 2025 | -- | $37,490 | $3,360 | $34,130 |
| 2024 | -- | $37,490 | $3,360 | $34,130 |
| 2023 | $2,751 | $16,940 | $3,430 | $13,510 |
| 2022 | $702 | $16,940 | $3,430 | $13,510 |
| 2021 | $704 | $16,940 | $3,430 | $13,510 |
| 2020 | $263 | $14,810 | $2,980 | $11,830 |
| 2019 | $259 | $14,820 | $2,980 | $11,840 |
Source: Public Records
Map
Nearby Homes
- 955 E Summit St
- 935 S Morgan Ave
- 442 S Liberty Ave
- 452 E Summit St
- V/L S Freedom Ave
- 726 S Arch Ave
- 1350 S Freedom Ave
- 234 Rosenberry St
- 231 Rosenberry St
- 1522 Wade Ave
- 226 Milner St
- 847 E Patterson St
- 834 Devine St
- 361 E Main St
- 167 11th St
- 134 11th St
- 1226 Noble St
- 46 Rosenberry St
- 807 S Union Ave
- 233 Shadyside Ct
- 1004 E Summit St
- 1020 E Summit St
- 0 Wade Ave S
- 1036 E Summit St
- 1046 E Summit St
- 1011 E Summit St
- 1003 E Summit St
- 930 E Summit St
- 1029 E Summit St
- 1035 E Summit St
- 922 E Summit St
- 715 Wade Ave
- 1104 E Summit St
- 662 Woodland Ave
- 725 Wade Ave
- 914 E Summit St
- 736 Wade Ave
- 927 E Summit St
- 927 E Summit St
- 927 E Summit St
Your Personal Tour Guide
Ask me questions while you tour the home.